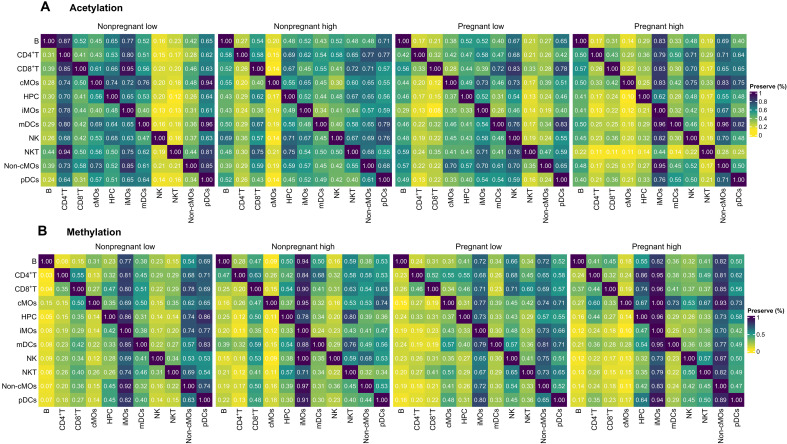
Fig. 7. PM2.5 exposure affects the similarity of immune cell type–specific HPTM interactions.
Module similarity is based on the proportion of HPTM interactions found in the row immune cells with strong evidence of preservation in the column immune cells. Heatmap (A) represents the acetylation HPTMs and (B) shows the methylation HPTMs. Note that the preservation scores should be read horizontally. Figure 7 summarizes the proportion of significant and strong (rho > 0.5) comethylation and coacetylation profiles predicted in each cell type (row) that are preserved in the other cell types (column). Preservation scores are expressed as % preserved co-modifications and are color-coded from yellow (low) to blue (high).

