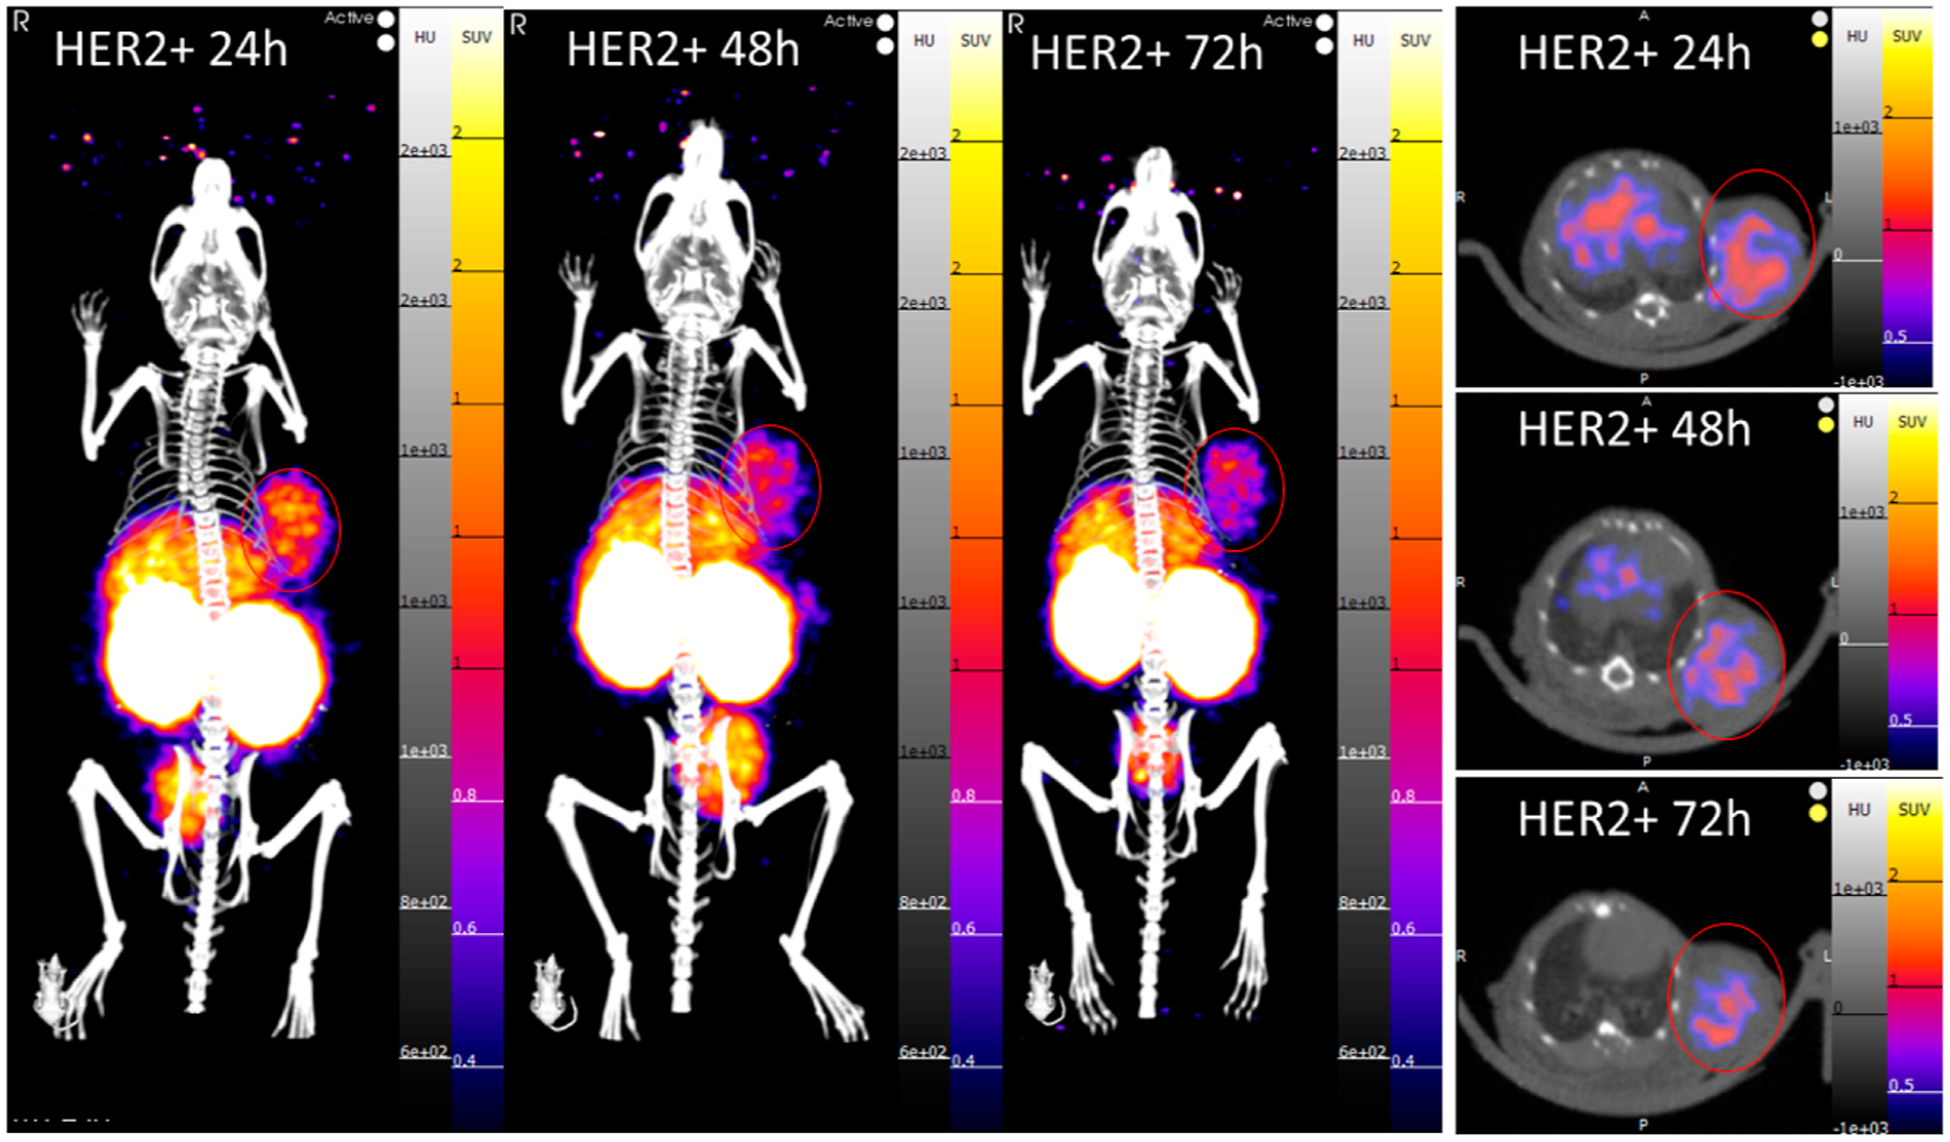
Figure 4.

PET/CT images at 24, 48, and 72 h postinjection of a HER2-positive tumor-bearing mouse (SUVmean scale 0.3–2). The tumor can be clearly visualized on the left shoulder of the mouse at all time points in both the maximum intensity projection (MIP) and transverse slice images.
