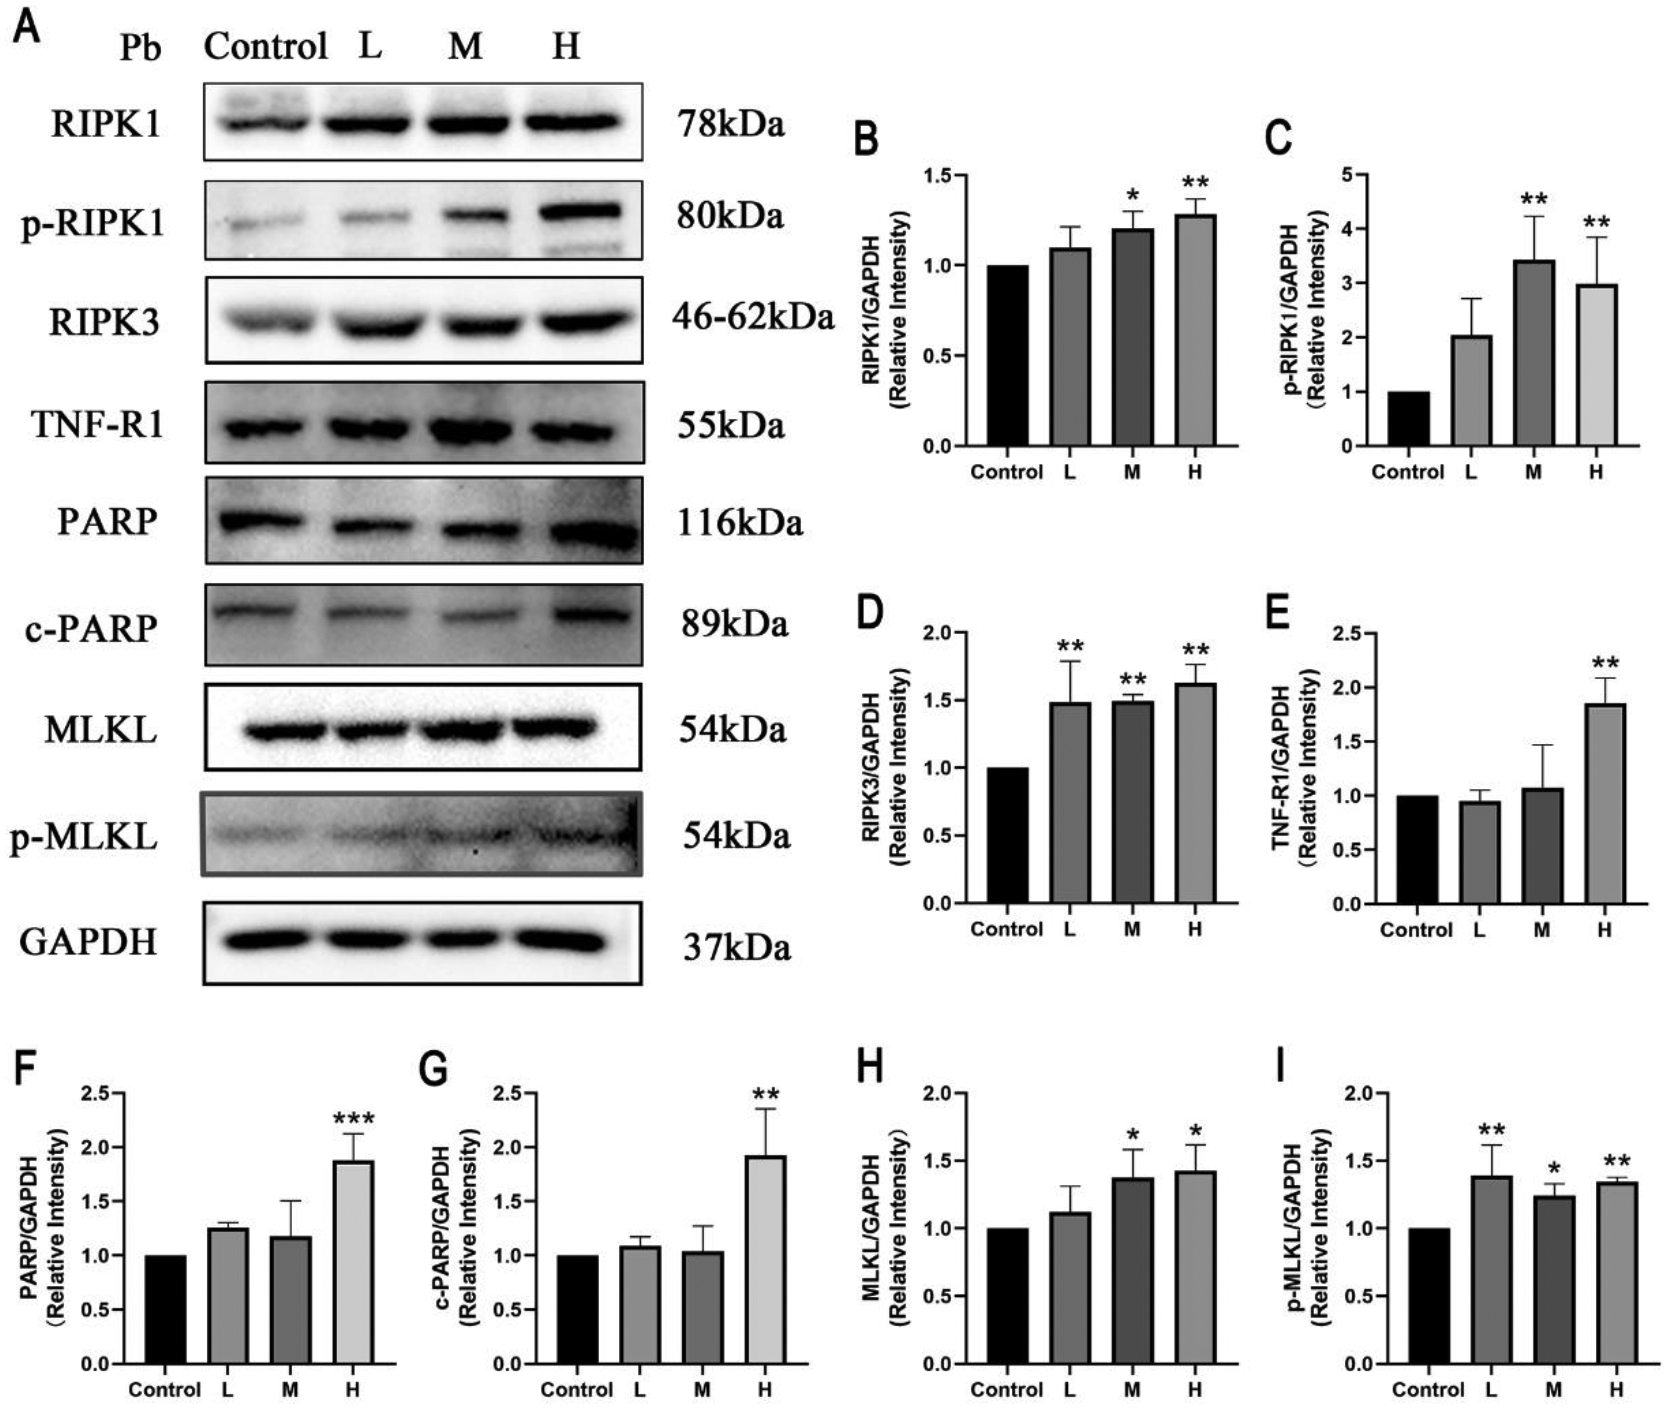
Fig 2.

Effects of Pb exposure on TNF-R1-RIPK1/RIPK3 signaling pathway of HT-22 cells
Note: Representative protein bands (A) and the protein expression (B-I) in the HT-22 cells. The relative quantity of all proteins was normalized to GAPDH. L, M, and H groups were treated with, 12.5, 50, and 200 μmol/L Pb(Ac)2 for 24 h; Values are presented as mean±SD (n=3). *P<0.05 and **P<0.01: compared to the Control group.
