
FIGURE 2.
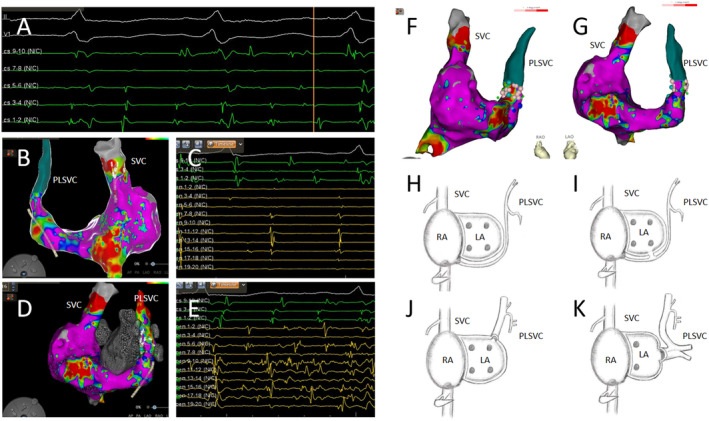
(A) Atrial fibrillation (AF) was induced using an S1S1 pacing protocol at 260 ms. (B) A three‐dimensional electroanatomical mapping of the right atrium shows the presence of a persistent left superior vena cava (PLSVC). The mapping electrode located within the superior vena cava (SVC) recorded potentials in the posterior–anterior view. (C) The mapping electrode (yellow) displays regular electrical potentials in the SVC, which are slower in frequency relative to those in the coronary sinus (CS) (green). (D)The three‐dimensional electroanatomical map of the right atrium with the mapping electrode positioned in the PLSVC records rapid and disorganized potentials in the anterior–posterior view. (E) The mapping electrode (yellow) in the PLSVC shows prolonged, fragmented, and regular potentials, which are faster than those in the CS (green). (F) A three‐dimensional model from the right anterior oblique perspective showing the ablation points (pink) at the proximal end of the PLSVC. (G) A three‐dimensional model from the left anterior oblique perspective also showing the ablation points (pink) at the proximal end of the PLSVC. (H–K) Three types of PLSVC configurations. (H) The PLSVC drains into the right atrium via the CS. (I) The PLSVC drains into the left atrium via the CS. (J) The PLSVC drains directly into the left atrium. (K) The PLSVC drains into the left atrium and is associated with pulmonary vein anomalies.