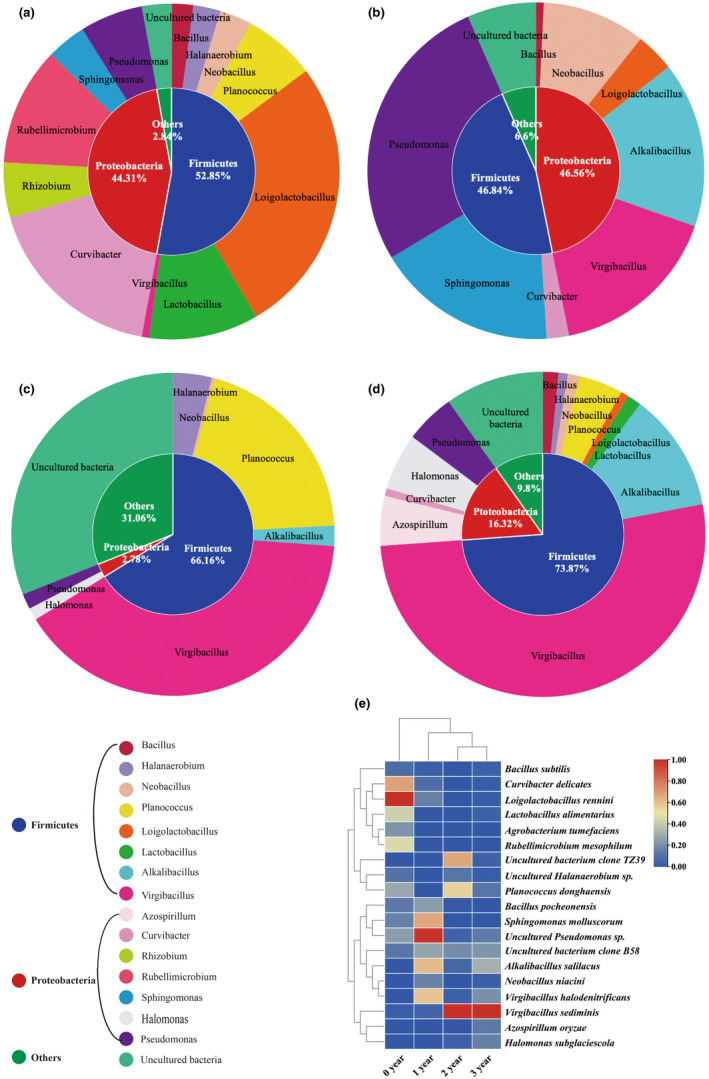
FIGURE 5.

Donut plots representing the bacterial population in ZZDJ samples from (a) 0 year, (b) 1 year, (c) 2 years, and (d) 3 years. The inner and outer circles display the percentage distribution at the phylum and genus levels, respectively. Heatmap plot of the (e) bacterial species present in the four ZZDJ samples from different fermentation periods of ZZDJ. The color intensity is proportional to the relative abundance of bacterial/ fungal species.
