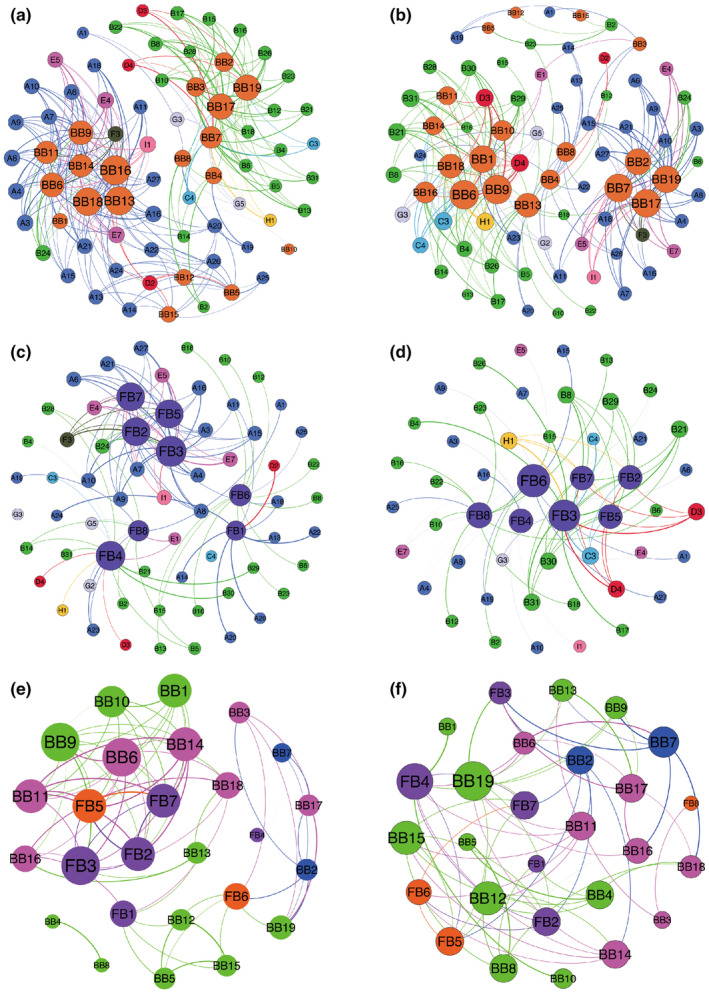
FIGURE 8.

Visualization of the correlation network according to significant correlations between volatile flavor compounds and (a and b) bacteria/(c and d) fungi in ZZDJ. Network of co‐occurring microbiota in ZZDJ based on correlation analysis (e and f). Positive correlation network: a, c, e; Negative correlation network: b, d, f. Each node represents a volatile compound or a microorganism and nodes of the same color are in the same category. In addition, the size of each node is proportional to the number of connections, and line width indicates the strength of the correlation. The code representative is displayed in Table 2 and Table S2.
