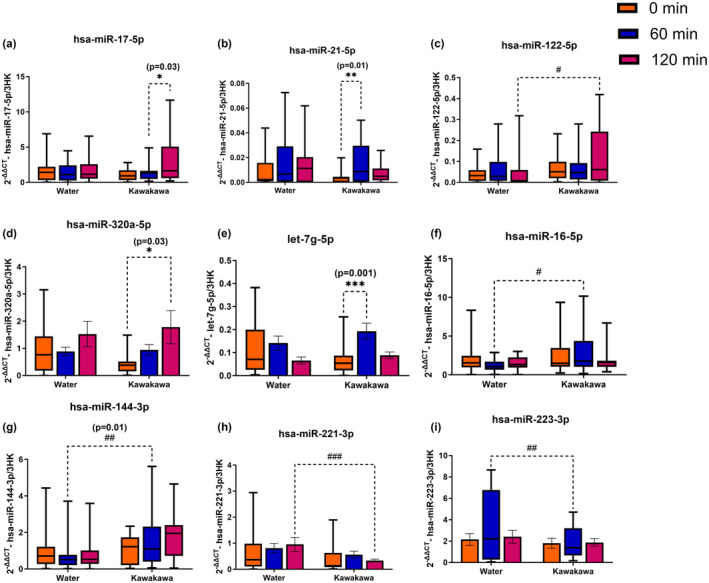
FIGURE 2.

Postprandial abundance of circulatory miRNAs. Different colors represent time points at fasting (0 min, orange color), at 60 min (Blue color) and at 120 min (Red color); *denotes a significant difference within the groups: *p ≤ .05, **p ≤ .01, ***p ≤ .001; #denotes a significant difference between the groups: # p ≤ .05, ## p ≤ .01, ### p ≤ .001.
