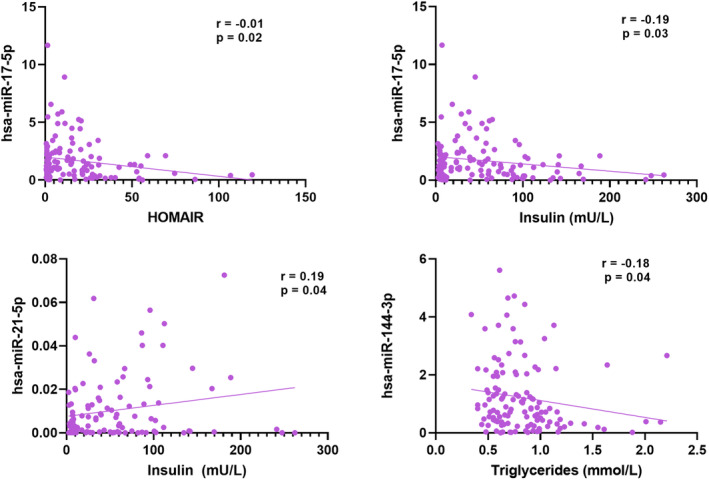
FIGURE 3.

Pearson's correlation plots. The biochemical parameters are plotted on the X‐axis, and the relative microRNA expression () is on the y‐axis. r‐correlation coefficient; p‐significance value.

Pearson's correlation plots. The biochemical parameters are plotted on the X‐axis, and the relative microRNA expression () is on the y‐axis. r‐correlation coefficient; p‐significance value.