FIGURE 4.

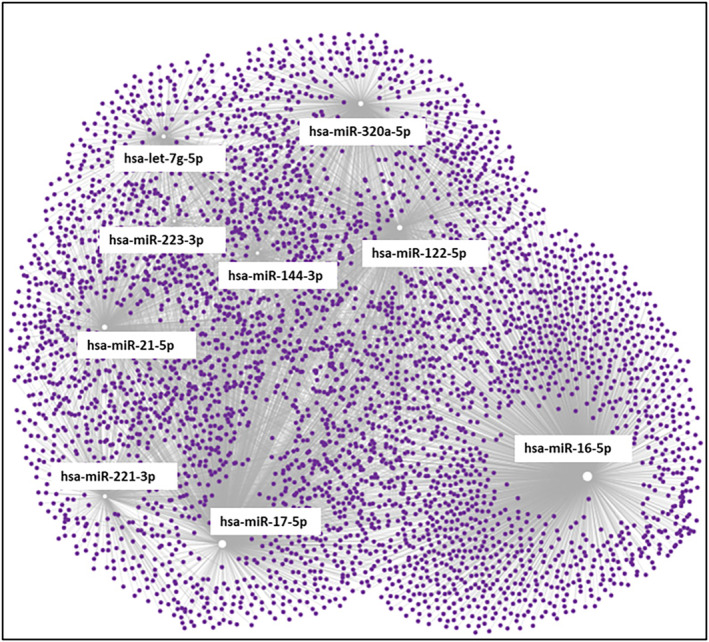
Functional enrichment analysis. Network visualization of the significant circulatory miRNA (White boxes) and their respective gene targets (purple dots).

Functional enrichment analysis. Network visualization of the significant circulatory miRNA (White boxes) and their respective gene targets (purple dots).