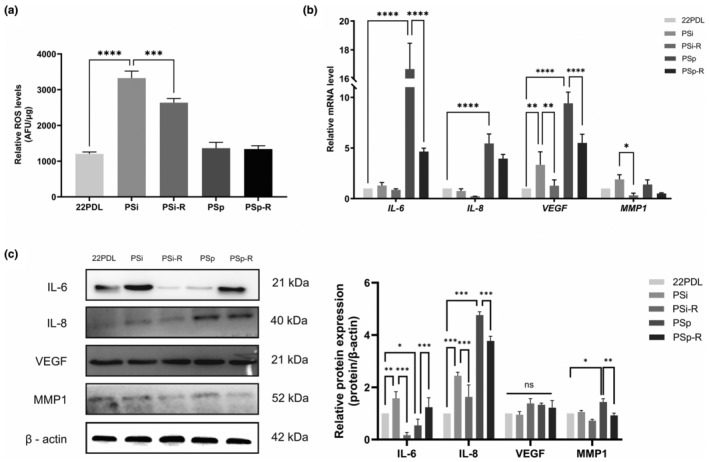
FIGURE 2.

ROS level and SASP expression. (a) Relative quantification of total ROS in cells. (b) The mRNA expression level of SASP (IL‐6, IL‐8, VEGF, and MMP1). (c) The relative protein expression of SASP. The data for each group are presented as the means ± SEMs (n = 3). *p < .05, **p < .01, ***p < .001, ****p < .0001, ns p > .05.
