
FIGURE 3.
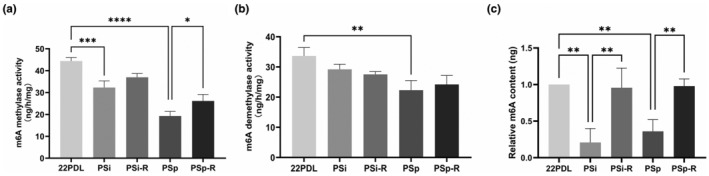
Changes of RNA m6A methylation microenvironment. (a) Activity of RNA m6A methyltransferases. (b) Activity of RNA m6A demethylases. (c) Overall RNA m6A methylation levels in cells. The data for each group are presented as the means ± SEMs (n = 3). *p < .05, **p < .01, ***p < .001, ****p < .0001.