
FIGURE 6.
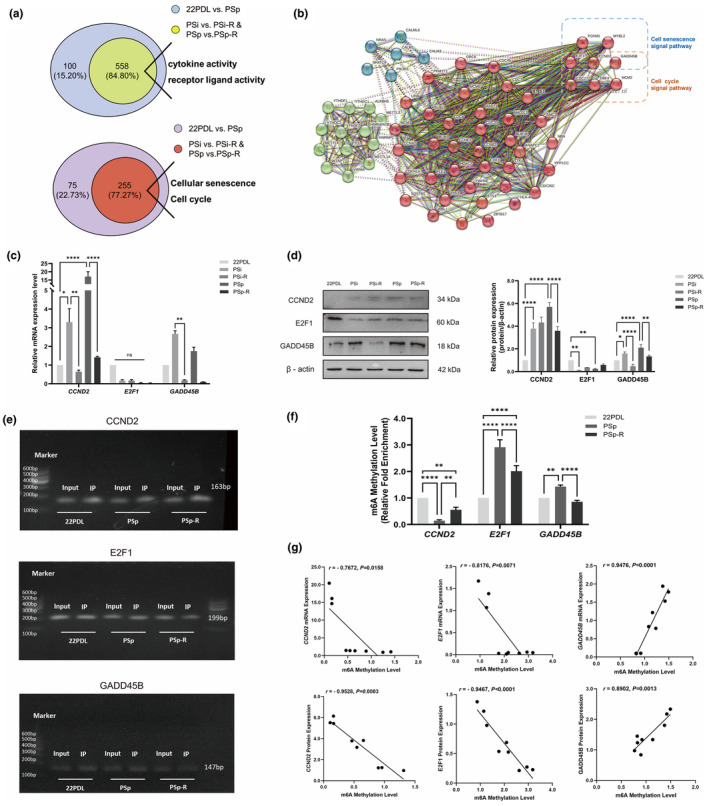
Screening of genes associated with aging. Expression of senescence‐related specific genes and the RNA m6A methylation modification. (a) Gene ontology enrichment of aging differential genes and intervention differential genes. Signaling pathways for enrichment of aging differential genes and intervention differential genes. (b) Network diagram of specific genes interacting with m6A regulator proteins (the solid line represented the direct relationship, and the dashed line represented the indirect relationship. Thicker wires indicated higher confidence. The green cluster was the m6A regulator, and the red and blue clusters were specific genes). (c) The mRNA expression levels of CCND2, E2F1, and GADD45B. (d) Protein expression levels of CCND2, E2F1, and GADD45B. (e) Gel electrophoresis of real‐time fluorescence quantitative PCR products of CCND2, E2F1, and GADD45B genes. (f) RNA m6A methylation levels of CCND2, E2F1, and GADD45B. (g) Correlation analysis of specific gene expression levels with their m6A methylation modifications. The data for each group are presented as the means ± SEMs (n = 3). *p < .05, **p < .01, ****p < .0001. ns p > .05.