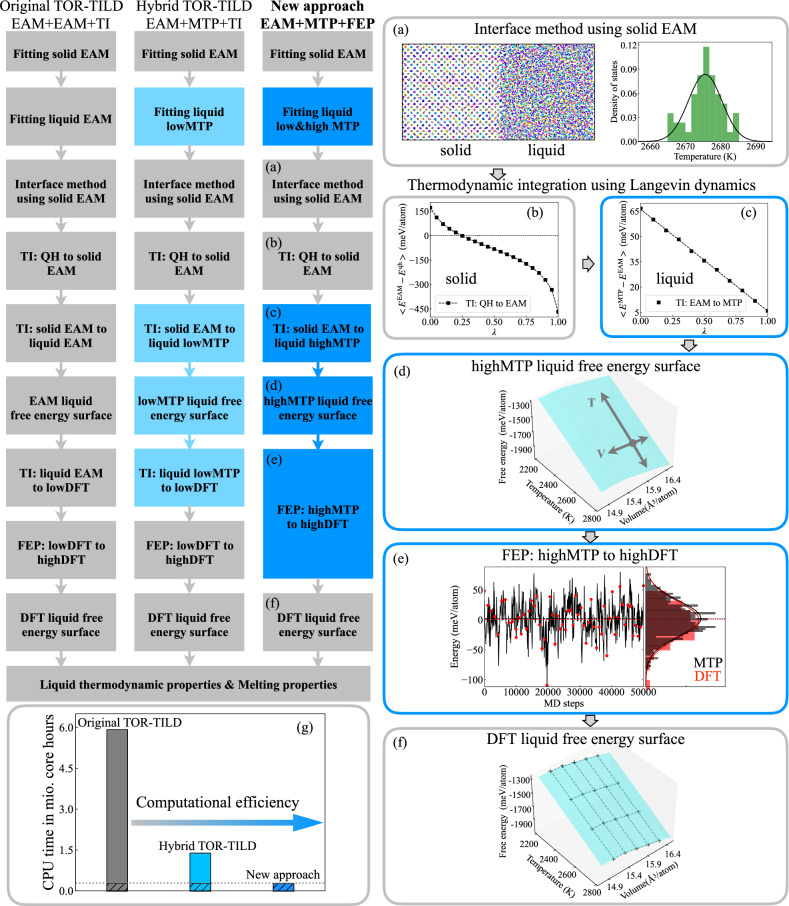
Fig. 1. Schematic of the proposed method for liquid free energy calculations in comparison to TOR-TILD.
Steps modified with respect to the original and hybrid TOR-TILD method are marked in light and dark blue, respectively. The workflow for the new approach is emphasized in (a)–(f). a Shows the solid-liquid interface structure used for predicting the melting point of the EAM and the resulting Gaussian distribution of the melting points. b, c Depict thermodynamic integration from an effective quasiharmonic (QH) reference to EAM and from EAM to MTP at the predicted melting point. d Represents the MTP liquid free energy surface calculated via integration of the internal energy and pressure along the temperature and volume dimensions starting from the free energy value (gray dot) obtained in (c). e Displays the MD trajectory of MTP (black line) and DFT snapshot energies (red dots) with their Gaussian distributions and mean values (dashed lines). f Is the DFT liquid free energy surface with the DFT data points marked by black crosses. See “Methods” section for additional details. g Compares the computational efficiency of the three methods.

