Abstract
The most significant external excitation affecting the dynamic characteristics of a vehicle is its driving environment. This type of excitation leads to issues such as slow initial response during starting, significant vibrations in the transmission system, and overall performance instability. A longitudinal–vertical coupled dynamics model has been developed to analyse the impact of driving conditions on the dynamic characteristics of vehicles with Dual-Clutch Transmission (DCT) during starting. This model takes into account factors such as the engine’s harmonic torque, the time-varying meshing stiffness of the gear system, the nonlinear torsional behaviour of the dual-mass flywheel, the deformation and torsion of the powertrain mounts, tire deformation, and random road excitations. Utilizing the established coupled model for DCT vehicle transmission systems, the impact of varying road roughness, adhesion coefficients, and road slope on the dynamic performance of DCT vehicles. To verify the accuracy of the simulation results of the influence of the driving environment on the dynamic characteristics of the DCT vehicle starting process, the experimental and simulation results of the influence of the driving environment on the vehicle dynamic characteristics of flat road surfaces, B-level uneven road surfaces, wet road surfaces, and 10% road slopes were compared. The overall trend of the simulation results of the clutch master and slave end speeds, vehicle longitudinal and vertical impact degrees, etc., was in good agreement with the experimental results, confirming the accuracy of the established DCT vehicle transmission system coupling dynamic model.
Keywords: Dual-clutch transmission, Internal and external excitation, Driving environment, Starting process, Dynamic characteristics
Subject terms: Mechanical engineering, Nonlinear phenomena, Applied mathematics
Introduction
The driving environment of a vehicle mainly includes road conditions, such as the unevenness, adhesion coefficient, and slope of the road surface. The conditions of the road have a direct impact on a vehicle’s traction and grip, which consequently influences its power output and stability. On roads with varying degrees of gradient, the gravitational force acting on the vehicle significantly affects its overall dynamic characteristics. The driving environment is directly related to the determination of the starting time of the vehicle and can also cause problems such as shaking, jerking, delayed response, and even clutch erosion1,2. Therefore, to accurately reflect the dynamic behaviour of dual clutch transmission (DCT) vehicles during the actual driving process, the internal excitation of the transmission system is considered. The jerk of the driving environment on the vehicle’s dynamic characteristics during the start-up process is also considered.
Researchers have conducted extensive studies on the effects of driving environments on vehicle dynamic behaviour3,4. Road excitations are the primary source of vehicle vibrations. Due to uneven road surfaces, road excitation can impact the characteristics of the vehicle during acceleration and gear shifting5. Therefore, the road roughness is the basic input for vehicle vibrations. Due to the fluctuations in the road, road excitation during vehicle driving can affect the vehicle’s dynamic behaviour during the start-up6. There have been numerous studies on the effects of road surface on the dynamic performance of vehicles5,7. Pisaturo et al.8 studied the dry dual clutch vehicle starting process under flat and uphill road conditions. Based on the proposed control strategy, which is based on model predictive control and the thermal compensation effect, the error was significantly better than that of the classical Pl control strategy, especially in road conditions with high slopes. Zhao9 studied intelligent gear decision based on driving intention and driving environment recognition, established a DCT vehicle dynamics model, and constructed an optimal gear sequence-solving problem based on dynamic programming algorithm according to the vehicle dynamics characteristics. She analysed the influence of different driving intentions and driving environments on vehicle gear decisions. Wei et al.10 have formulated a three-degree-of-freedom dynamic model, considering road unevenness, to analyse the influence of road excitations on the shimmy response behaviour of vehicles under varying speed conditions. Using a quarter-car model as a basis, Wedig11 investigated the issue of vehicle resonance under varying road excitation conditions. Under strong nonlinear systems in longitudinal road vehicle dynamics, these conditions result in vehicles becoming stuck before they reach resonance when driving over wavy road surfaces. Based on a quarter-car dynamics model, Wei et al.12 investigated the influence of road excitation on vehicle shimmy behaviour across various speed ranges. Based on the bifurcation analysis of the shimmy system, when the influence of sinusoidal road roughness is considered, the system experiences Hopf bifurcation at a specific speed. At this point, the periodic solutions of the shimmy system lose stability, and the dynamic response of the front wheel transitions from single-periodic motion to quasiperiodic motion. Melcer et al.13 investigated the impact of road roughness on vehicle vibration and the dynamic components of tire forces. For specific types of roads, the contact between the wheels and the road will be lost, and the wheels will bounce off the road, such as the rear wheels on C-class roads and the front wheels on E-class roads. Based on a 12-DOF dynamics model that incorporates wheels, suspension, and steering systems, Wei et al.14 studied the effects of road roughness on vehicle shimmy. The results show that a decrease in the front wheel track is an effective way to attenuate vehicle shimmy for different road roughness excitations. By creating a dynamic coupled model for gear shafts and gearboxes subjected to random road excitations, Fu et al.15 investigated the varying random road excitations and road gradients affect the dynamic response of the gearboxes. Blekhman et al.16,17 analysed the effect of road roughness on the interaction between a vehicle’s longitudinal and vertical dynamics, employing a quarter-car model. Application of the method of direct separation of motions gives a rather simple expression for vibrational resistance force depending on the averaged velocity and its derivative with respect to the longitudinal coordinate. Notably, the coefficient of road adhesion is a significant factor influencing the vehicle’s driving safety and stability. For example, a small road adhesion coefficient may cause a vehicle’s tires to slip, causing unstable shifting transition18,19 and affecting the vehicle’s starting and shifting performance. Ahn20 et al. established a lateral and yaw dynamic model of a vehicle and estimated the friction coefficient under concrete, ice- and snow-covered pavements. Hu et al.21 introduced a method for estimating the tire-road friction coefficient in real-time, relying on vehicle lateral dynamics. This method uses a straightforward three-freedom-degree model to assess the friction coefficient between the tires and the road under diverse road conditions. Peng et al.22 developed a tire friction model, a wheel dynamic model, and a vehicle transmission system dynamic model. These models consider the lateral and longitudinal movements of vehicles. They also studied the effects of different road adhesion coefficients on vehicle stability. A new nonlinear observer has been proposed for estimating the longitudinal velocity, lateral velocity, and tire‒road friction coefficient. Modular observer based on longitudinal tire force estimation method and tire lateral friction model design. Compared with existing methods, this method simultaneously estimates vehicle speed and identifies the friction coefficient between tires and road surfaces under different road conditions. Zhao et al.23 introduced a road friction coefficient estimation method rooted in the dynamics of vehicle braking to mitigate the chattering phenomenon of sliding mode controllers. The results indicate that under different road conditions, the estimated values match the actual values well, with strong robustness and high accuracy.
The effect of driving environments on vehicle’s dynamic characteristics at varying road slopes was examined. Liu et al.24 showed that road gradients have a notable influence on the dynamic behaviour of vehicles, with slopes ranging from 5 to 8% having the greatest effect on vehicle performance. Feng25 established a dynamic model for automotive transmission systems taking into account the engine, clutch, transmission shaft and conducted research on data-driven intelligent gear selection strategies that incorporate driving intent and road inclinations. Meng et al.26 developed a dynamic shifting strategy based on vehicle uphill and downhill dynamics models. These models consider the power performance of vehicle uphill conditions, the safety of downhill conditions, and the efficiency of gentle slope conditions, improving the power and fuel efficiency of vehicle driving on slopes. In summary, the driving environment, such as road roughness, road adhesion coefficient, and road slope have a significant influence on the dynamic behaviour of vehicles during actual driving. However, when researchers study the influence of the driving environment on vehicle dynamics, they often rely on simplified vehicle dynamics models, without fully considering the influence of internal excitations in the vehicle’s transmission system on the vehicle’s dynamics. Therefore, actual vehicle dynamics during driving cannot be reflected accurately.
Based on the above research status, the impact of the driving environment on vehicle dynamic behaviour can be summarized in the following three key points. (1) Road roughness and vehicle vibration: The unevenness of the road surface is the main external excitation that causes vehicle vibration. Researchers have used different dynamic models, such as a three-degree-of-freedom model and a quarter car model, to analyse how road excitation affects a vehicle’s shimmy response and overall dynamic performance under different speeds and speed conditions. These studies indicate that the characteristics of the road surface directly affect the ride comfort, handling stability, and structural durability of vehicles. (2) Road adhesion coefficient and driving stability: The road adhesion coefficient is crucial for ensuring the safe operation of vehicles. Under low-adhesion conditions, such as roads covered in ice and snow, tire slippage may occur, which can affect the smoothness of gear shifting transitions and the overall dynamic performance of the vehicle. To better understand and predict this impact, researchers have developed various methods and techniques to estimate the friction coefficient between tires and road surfaces, including models based on vehicle lateral or longitudinal dynamics. (3) Road slope and transmission system performance: Road slope significantly affects the power output demand and efficiency of vehicles. Scholars have proposed several improvement measures to address this issue, such as intelligent gear selection strategies and dynamic shifting logic, which consider the balance between uphill power performance and downhill safety. By optimizing the operating parameters of the transmission system, fuel economy and driving experience can be improved while ensuring driving safety. Current research typically relies on simplified vehicle dynamics models. These simplified models may not fully consider the specific impact of internal excitations in the vehicle transmission system on actual dynamic behaviour. Therefore, deviations or inaccuracies may exist in simulating the dynamics of vehicles under real driving conditions.
The driving environment directly affects the dynamic characteristics of the vehicle during actual driving. Researchers who have studied the influence of the driving environment on vehicle dynamics behaviour have often relied on simplified vehicle dynamics models without fully considering the impact of internal excitation in the vehicle transmission system on vehicle dynamics, especially neglecting the influence of suspension characteristics. Therefore, accurately reflecting the actual vehicle dynamics during the driving process is impossible. This work establishes a DCT vehicle longitudinal vertical coupling dynamic model considering internal and external excitation coupling, focusing on the interaction between the powertrain, suspension, and vehicle, especially the longitudinal vertical interaction relationship between the powertrain and suspension. The correctness and rationality of the vehicle model considering internal and external stimuli established in this article have been verified through experiments. This study provides a theoretical basis for improving the dynamic performance of DCT vehicles during operation.
Coupled dynamic modelling of a DCT transmission system considering internal and external excitation
The DCT vehicle power transmission system is a complex nonlinear coupled system. This work establishes a longitudinal vertical coupled dynamic model of the entire vehicle, considering the harmonic components of the gas torque in the engine cylinder and the influence of the reciprocating inertia torque of the engine, and establishes an engine harmonic torque model. A dynamic model of a gear system considering time-varying mesh stiffness was established via the lumped parameter method. Assuming that the powertrain is a rigid body, a 6-degree-of-freedom dynamic model is considered for the translational and torsional motion of the powertrain suspension along the longitudinal, vertical, and transverse directions. This model considers the coupling effect of the dynamic excitation of key components of the DCT vehicle transmission system on the starting dynamic characteristics of DCT vehicles. Considering the interaction between the powertrain, suspension, and driving environment, a coupled dynamic model was established for the DCT and its related systems. A longitudinal vertical coupled dynamic model of DCT vehicles was constructed via the lumped parameter method to investigate the effects of different road roughness, adhesion coefficients, and road slopes on the dynamic performance of DCT vehicles.
Engine harmonic torque model
Among the primary excitation sources in DCT vehicle transmission systems, the engine output torque stands out as a significant one. In the current research on DCT system dynamics simulation analysis, the engine employs an average torque model, utilizing a look-up table method, and takes into account the throttle opening and rotational speed of the engine. In order to ascertain the engine’s output torque, the impact of harmonic torque during the engine’s operation is neglected. To accurately analyse the impact of the actual output torque during engine operation on the vehicle system’s dynamics, an engine harmonic torque model was established. This model considers the harmonic component of the gas-acting torque in the engine cylinder and the impact of the reciprocating inertia torque of the engine.
Referring to the research conducted by Crowther et al.27, this paper establishes an engine harmonic torque model based on the average engine torque model, considering the engine torque fluctuations caused by cylinder phase ignition and reciprocating inertial torque, as shown in Eq. (1).
 |
1 |
In this equation, Tem represents the torque derived from the average engine torque model, which accounts for engine intake, combustion, and torque generation.  denotes the sum of the harmonic components of the engine torque, reflecting the torque fluctuations resulting from phased ignition in each cylinder and the corresponding changes in gas forces. Treci represents the reciprocating inertial torque.
Dual-mass flywheel dynamic model
The dual-mass flywheel(DMF), as an essential torsional vibration component installed between the engine and clutch input, can block the transmission path of vibrations during engine operation, reducing the influence of engine torque fluctuations on the clutch and the vehicle powertrain system. A three-stage nonlinear torsional stiffness dynamic model of the DMF was developed through the application of the concentrated parameter method, as illustrated in Fig. 1a. Figure 1b shows the torsional characteristics of the DMF.
Fig. 1.
Dynamic model of a DMF. (a) Dynamic model of a DMF (b) torsional characteristics curve of a DMF.
In this figure, If1 represents the moment of inertia of the primary flywheel, If2 is the moment of inertia of the secondary flywheel, T1 is the driving torque applied to the primary flywheel, T3 is the torque exerted by the clutch on the secondary flywheel, K2 is the three-stage nonlinear torsional stiffness between the first-stage and second-stage flywheels, and C2 is the spring damping between the primary and secondary flywheels.
The dynamic formulation of the DMF is expressed as Eq. (2).
 |
2 |
In this equation,  ,
,  ,
,  ,
,  ,
,  , and
, and  denoting angular acceleration, angular speed, and angular displacement separately, corresponding to the primary and secondary flywheels.
Dynamic model of a DCT gear system
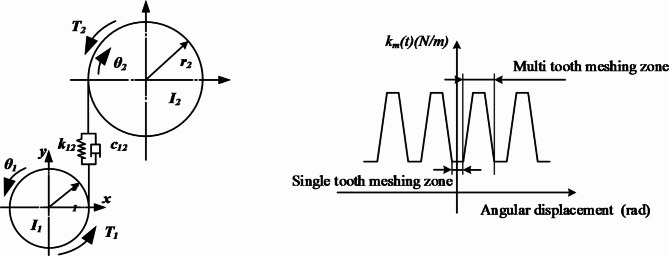
The dynamic excitation of the gear mesh stiffness is caused by alternating gear teeth meshing during the gear meshing process. It is also one of the most important forms of dynamic excitation in gear transmission systems. A dynamics model of a gear system that incorporates time-varying meshing stiffness has been formulated using the method of lumped parameters, depicted in Fig. 228.
Fig. 2.
Dynamic model of a gear system. (a) Gear pair (b) time-varying mesh stiffness of gears.
By employing a Fourier series method, the time-varying mesh stiffness is transformed into a function that varies periodically with the rotation angle of the gear.
 |
3 |
 |
4 |
Where  is the average meshing stiffness over one meshing cycle. which can be obtained through empirical formulas. l is the harmonic number. al is the Fourier series expansion coefficient. Z1 is the number of teeth on the driving gear. θ1 is the rotation angle of the gear. γ12 is the initial phase angle of the mesh stiffness. ks is the single-tooth mesh stiffness. εα is the overlap coefficient.
Ignoring the time variation of the gear mesh damping, the mesh damping is represented as a linear time-invariant parameter.
 |
5 |
In this formula, ζ12 is the damping ratio of the mesh, which is typically a value between 0.03 and 0.17, and mi is the mass of gear i.
Dynamic model of the powertrain suspension system
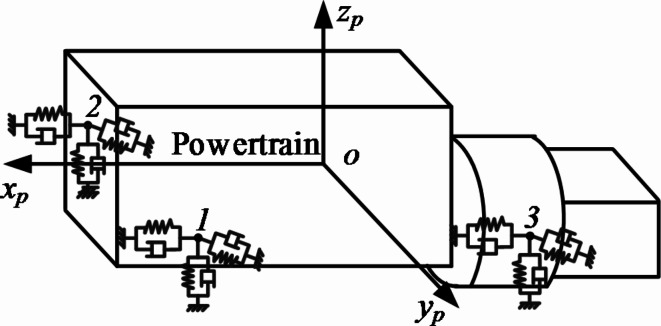
The mount is a component that connects the powertrain and chassis. It’s main function is to minimize the transmission of engine vibrations and support the vehicle’s powertrain, thus playing a vital role in enhancing the overall noise, vibration, and harshness (NVH) performance of the vehicle. Assuming the powertrain as a rigid body, the mounting is simplified to a 6-degrees-of-freedom dynamic model considering translational and torsional motions along the longitudinal, vertical, and lateral directions29, as illustrated in Fig. 3.
Fig. 3.
Dynamic model of a powertrain mount.
As shown in the figure, o-xpypzp represents the moving coordinate reference system, o is the centroid of the powertrain. xp is the advancing direction of the vehicle, zp is the vertical direction of the vehicle, and yp is dictated ed by the right-hand rule. Points 1, 2, and 3 represent three powertrain suspension points. The generalized coordinates for the powertrain suspension system are denoted as q (xp ypzpθxpθypθzp)T.
Using the Lagrangian method, the vibration differential equations for the powertrain suspension system are established. The equation is as follows:
 |
6 |
In this equation, ET stands for the kinetic energy of the system, EV stands for the system’s potential energy, ED represents the system dissipative energy, and F represents the generalized forces acting on the system.
The kinetic energy of the powertrain system includes both translational and rotational kinetic energy and can be expressed as:
 |
7 |
where the mass matrix M is:
 |
8 |
According to the definition of the potential energy of the suspension system:
 |
9 |
where:
 |
10 |
The dissipative energy of the powertrain system is given by:
 |
11 |
where:
 |
12 |
Tire dynamic model
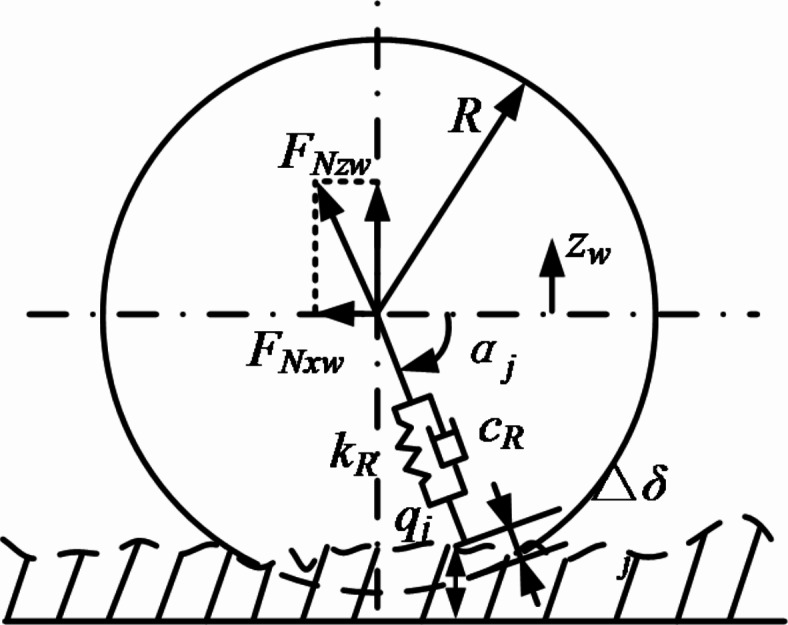
Reference30 introduced the elastic behaviour of tires and developed a specific deformation model that combines the stiffness matrix of each wheel and axle with the stiffness matrix of the vehicle spring suspension. As a crucial component in a vehicle propulsion system, the tire plays a primary role in supporting the vehicle and mitigating the impact forces transmitted from the road surface. The key indicator of the influence of road irregularities on vehicle dynamics is tire forces. The tire force model is composed of Nt individual radial springs and discrete radial damping elements. Each radial unit is characterized by a spring stiffness kR and a damping coefficient cR. These elements are evenly distributed in the lower half of the circle, as shown in Fig. 4.
Fig. 4.
Tire force model.
In this figure, αj represents the angle between the component and the positive direction of the x-axis, the subscript j is the index of the component, ranging from 1 to Nt, Δδj represents the deformation of the jth radial element, and Δvj represents the deformation rate.
Taking the specific radial spring and damping element in Fig. 4 as an example. Based on the perspective of the components, the vertical component FNzwj and the longitudinal component FNxwj of the radial spring and damping element are represented as:
 |
13 |
 |
14 |
Road excitation model
The road condition is the primary external excitation of a vehicle system. Different types of road surfaces, road conditions, and slopes can affect vehicle vibration characteristics, passenger comfort, and overall vehicle and individual component reliability31,32. Based on the GB7031-86 specification, the roughness of a road surface is categorized into eight levels, designated as A through H. In China, the road roughness of high-grade highways is generally within the range of Grades A, B, and C, with Grades B and C being the main categories33. Road roughness is primarily described using the statistical characteristics of the power spectral density of the road profile. The power spectral density is typically represented in terms of the spatial frequency, as shown in expression (15).
 |
15 |
In this equation, Gq(n0) represents the road roughness coefficient, n represents the spatial frequency, n0 is the reference spatial frequency, and ω is the frequency exponent.
Based on the vehicle speed, Gq(n) can be translated into temporal power spectral density Gq(f). As a vehicle moves over a road surface with spatial frequency n at a speed of v, the system’s time frequency is given by f = vn. Thus, a transformation relationship between Gq(f) and Gq(n) is derived:
 |
16 |
The power spectral density of the road’s vertical velocity and acceleration in the time-frequency domain is specified as follows:
 |
17 |
 |
18 |
A coupled dynamics model for DCT vehicle powertrain systems considering internal and external excitations
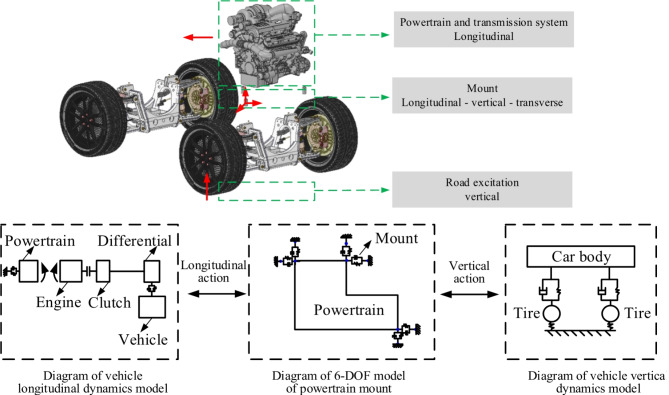
Taking into account the interplay between the powertrain, suspension mounts, and the vehicle, a coupled dynamics model has been formulated for the DCT and its associated systems. Road roughness can induce vertical vehicle vibrations, leading to deformation in the powertrain suspension and affecting the vertical motion of the vehicle. The longitudinal–vertical interaction relationship for the vehicle considering the powertrain suspension is illustrated in Fig. 5.
Fig. 5.
Diagram representing the longitudinal-vertical interaction of a vehicle.
DCT vehicle longitudinal dynamics model considering internal and external excitations
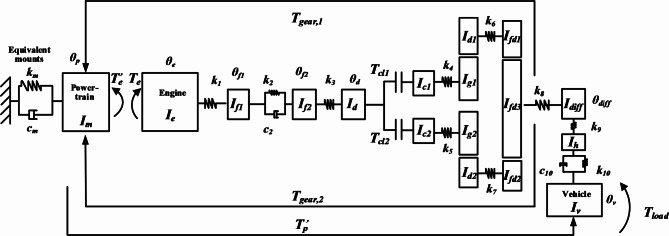
Taking into account the interplay between the dynamic suspension system and the vehicle, a DCT vehicle’s longitudinal-vertical coupled dynamics model, which incorporates the dynamics of the mount, has been constructed utilizing the lumped parameter method. As depicted in Fig. 6, for clarity, the powertrain suspension is represented as a single-degree-of-freedom torsional spring and damper system. However, in actual calculations, the powertrain suspension is considered a 6-degrees-of-freedom model, as depicted in Fig. 334.
Fig. 6.
The longitudinal dynamic model of a dual-clutch automatic transmission.
In this figure, the excitation force acting on the mount system is:
 |
19 |
where
 |
20 |
In this equation, Fmou is the total force applied to the longitudinal suspension, 4 denotes a four-cylinder engine, θ is the installation angle of the powertrain, ωe is the angular velocity of the engine crankshaft, r is the crank radius, λ is the ratio of the crank radius to the connecting rod length, m2 is the mass of a single piston and reciprocating components, A is the horizontal distance between the centre axes of cylinders 2 and 3 to the centre of mass of the powertrain. and Te is the engine output torque.
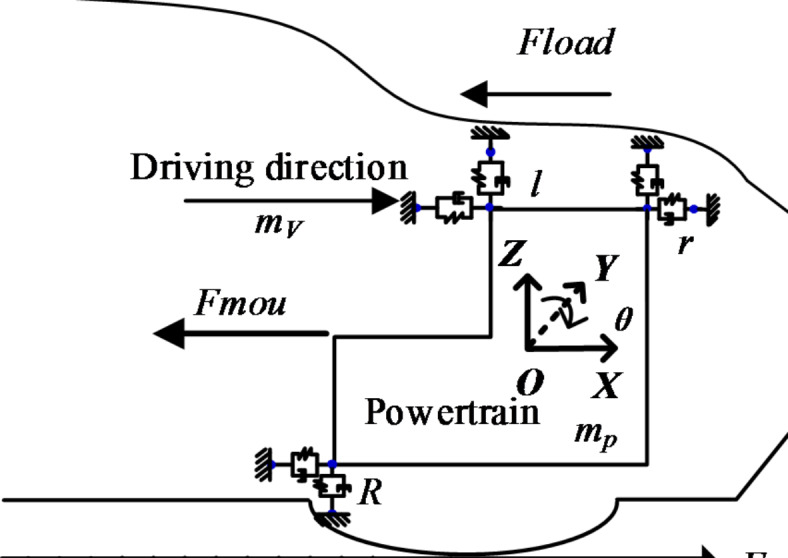
Considering the coupled dynamic relationship between the powertrain suspension and the vehicle, a dynamic model of the DCT system with mounts is developed. The interplay between the powertrain and the vehicle through the mount is exhibited in two primary aspects:
① There is a flexible connection between the powertrain and the vehicle chassis through the suspension. There exists relative motion between the powertrain system and the chassis, and forces are transmitted through the suspension. The interaction between the powertrain and the longitudinal dynamics of the DCT vehicle is illustrated in Fig. 7.
Fig. 7.
Longitudinal relationship between the powertrain and vehicle.
The longitudinal dynamics equation that describes the interaction between the powertrain system and the vehicle is:
 |
21 |
② The reactive torque exerted on the powertrain in operation is closely related to the engine output torque and the torque transmitted by the DCT. The overall reactive torque Tp is related as follows:
 |
22 |
According to Eq. (20), which is the excitation force acting on the powertrain suspension system, the 6-degrees-of-freedom vibration equations for translational and torsional motion along the longitudinal, vertical, and lateral directions of the powertrain suspension system concerning the vehicle’s forwards motion are as follows:
 |
23 |
In conclusion, utilizing the comprehensive vehicle dynamics model depicted in Fig. 6 and accounting for the powertrain suspension, the longitudinal dynamics equation for DCT vehicles can be formulated as:
 |
24 |
DCT vehicle vertical dynamics model considering internal and external excitations
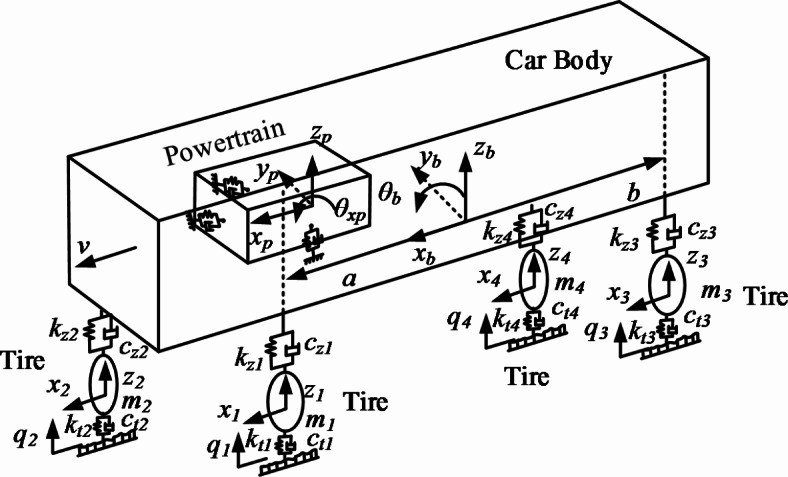
As shown in Fig. 5, based on the interaction between the powertrain system and the vehicle, a vertical dynamic model of the vehicle is established using the lumped parameter method, as depicted in Fig. 8. The model takes into account the vertical motion of the four wheels, the vertical, longitudinal, and pitch motions of the vehicle body, as well as the translational and torsional motions of the powertrain suspension system in the vertical, longitudinal, and lateral directions.
Fig. 8.
Vertical dynamic model for a DCT vehicle.
The wheel’s vertical dynamics are expressed in the equation:
 |
25 |
The vertical dynamic equation for the vehicle body centre of mass is:
 |
26 |
where
 |
27 |
 |
28 |
 |
29 |
 |
30 |
Pitch dynamic equation for the vehicle body:
 |
31 |
The longitudinal dynamic equation for the vehicle is:
 |
32 |
The dynamic equations for the powertrain suspension system concerning translational and torsional motion along the vehicle’s forwards, vertical, and lateral directions are given by Eqs. (23)–(28).
In these equations, xp, yp, zp, z1, z2, z3, z4, zb, xb, θxp, θyp, θzp and θb represent the vertical displacement and pitch displacement of the powertrain, vehicle body, front wheels, rear wheels, and vehicle, respectively.
Research on the dynamic characteristics of the initial driving process of DCT vehicles under different driving environments
To analyse the effects of various driving environments on the dynamic behaviours of DCT vehicles under the coupling effects of internal-external excitation, based on the established internal and external excitation coupling model, the influence of varying road roughness, road adhesion coefficients, and inclines on a vehicle’s starting dynamics, accounting for both internal and external excitation, is investigated.
The influence of road roughness on the starting process of DCT vehicles
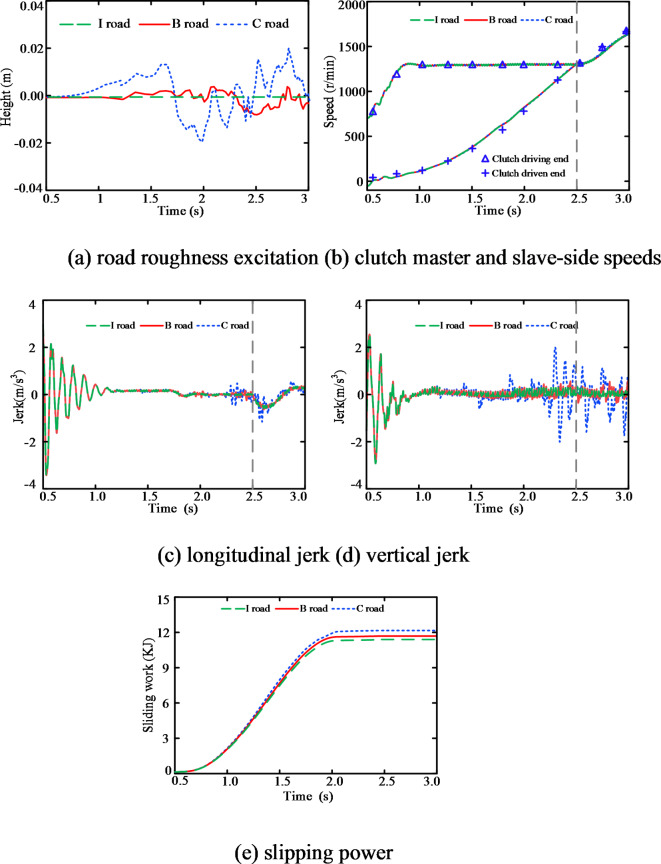
With the DCT vehicle dynamics model that considering both internal and external excitations as the foundation, the analysis primarily focuses on the influence of the dynamics of DCT vehicles on straight roads (without considering road excitations) as well as on B-class and C-class randomly excited roads. To simplify, straight road surfaces are denoted as the letter I. Using Matlab/Simulink and Runge Kutta solver, in order to ensure accuracy and stability, the step size is fixed at 10− 6 and the sampling frequency is 1 kHz. The simulation results are shown in Fig. 9.
Fig. 9.
The coupled effect of the road roughness and internal excitation on the starting process of the vehicle.
As shown in Fig. 9a, the random road excitations encountered by the vehicle during its travel on three distinct road types - straight road (I), B-grade road, and C-grade road are presented. Initially, there are fluctuations in both the master and slave-side speeds of the clutch, but the overall impact is minimal, and there is no significant influence on the starting time, as illustrated in Fig. 9b. As depicted in Fig. 9c, d that when considering internal and external excitation, there are significant low-frequency oscillations and the jerk in the longitudinal and vertical directions during the initial stage of the starting. Considering the analysis from Sect. 3.3, it can be inferred that the low-frequency oscillations and impacts are caused by suspension deformations. Engine output torque fluctuations can induce low-amplitude oscillations and the jerk in both the longitudinal and vertical directions of the vehicle. With B-grade and C-grade random road excitations, the vehicle encounters low-frequency, high-amplitude fluctuations and jerk in both the longitudinal and vertical directions. The vehicle’s longitudinal and vertical jerk fluctuations intensify as the road roughness escalates. In addition, the influence of road excitation on vertical oscillation of the jerk becomes more pronounced. Under the random road excitations of C-grade, B-grade, and I, the maximum vertical jerk of the vehicle upon completion of starting is 4.27 m/s3, 1.08 m/s3, and 0.89 m/s3, respectively. Figure 9e shows that when the internal and external excitation factors are coupled, varying the road roughness has a certain impact on the clutch slipping power. As the road excitation increases, the slipping power of the clutch during the starting process also increases.
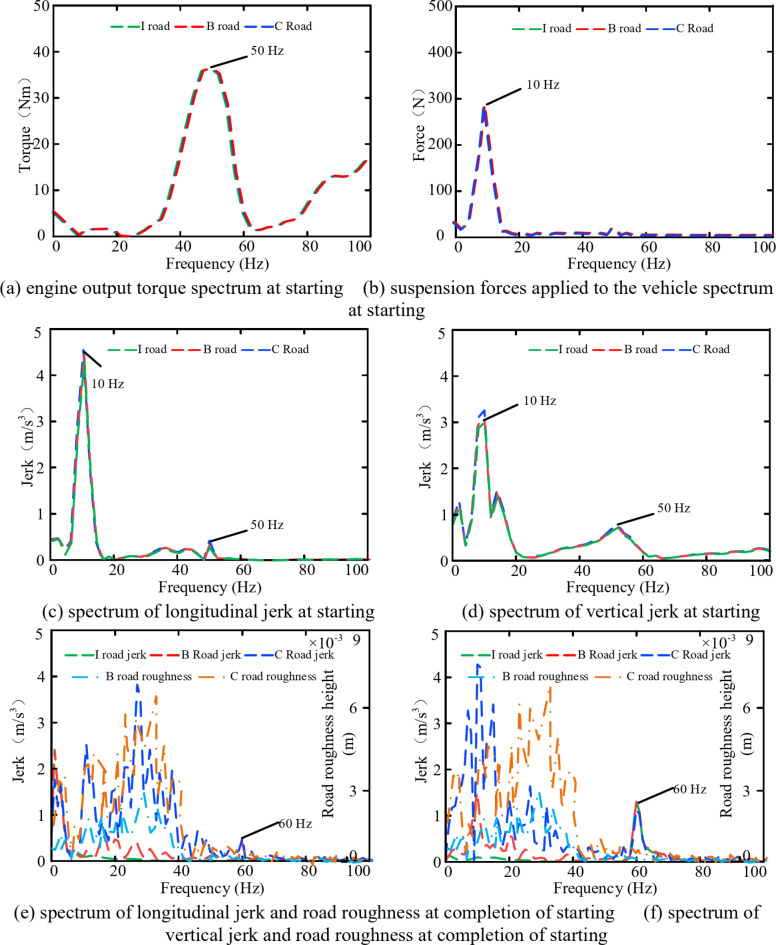
Frequency spectrum analysis is conducted on the longitudinal and vertical jerk, the force exerted by the suspension on the vehicle, engine output torque, and road roughness. The results are illustrated in Fig. 10a–f. Figure 10a, b show that during the initial stage of starting, the main frequencies of the engine torque and the forces applied to the vehicle from the suspension are 50 and 10 Hz, respectively. In the same stage, the longitudinal and vertical jerk of the vehicle occur at the same frequency, and the amplitude at 10 Hz is significantly larger than that at 50 Hz. As Fig. 10e, f demonstrate that at the final stages of the starting, when the vehicle speed is higher, the influence of random road excitations becomes more pronounced. The longitudinal and vertical jerk of the vehicle exhibit fluctuations induced by road roughness within the frequency range of 0–40 Hz. During this time, fluctuations in engine output torque induce 60 Hz the jerk in both the longitudinal and vertical directions, but their amplitudes are significantly smaller than the influence caused by road excitations.
Fig. 10.
Spectral diagram of the starting conditions under the coupling effect of road roughness and internal excitation.
The influence of road adhesion coefficient on the starting process of DCT vehicles
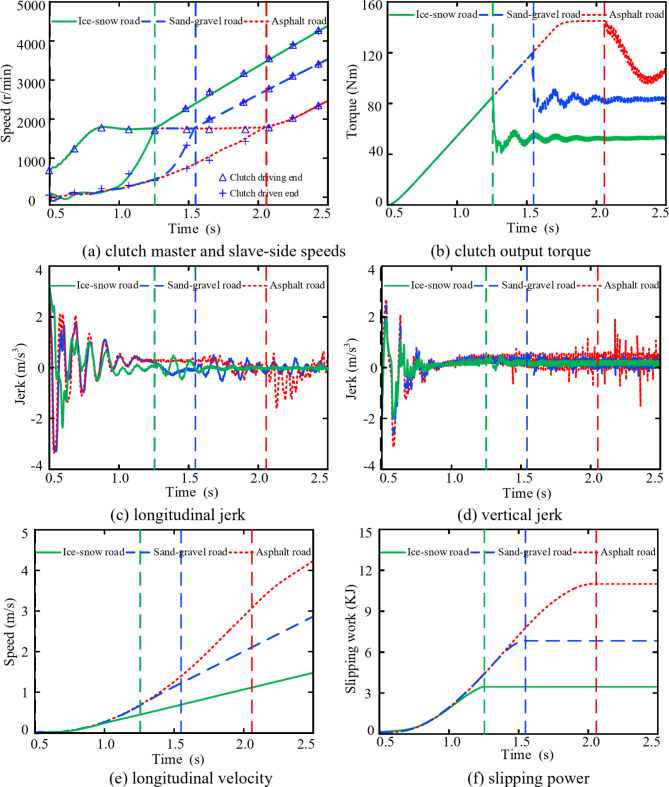
The vehicle performance exhibits significant differences when driving on surfaces with different adhesion coefficients. The adhesion coefficient on dry asphalt surfaces is typically approximately 0.85, while on ice- or snow-covered surfaces, the adhesion coefficient decreases to 0.2. A lower adhesion coefficient results in reduced tire traction, consequently lowering the vehicle’s driving stability performance. The effects of dry asphalt, gravel, and snow-covered (compacted) surfaces on the dynamic performance of a vehicle at starting were studied, with the results illustrated in Fig. 11.
Fig. 11.
The coupling effect of road adhesion coefficient and internal excitation on the vehicle’s starting process.
Figure 11a illustrates that, at a constant engine speed, the resistance torque acting on the vehicle decreases as the road adhesion coefficient diminishes. Therefore, the driven side speed of the clutch increases, leading to a shorter starting time. Meanwhile, with the decrease in the road adhesion coefficient, the torque transmitted by the clutch at the completion of the starting is smaller, resulting in smaller torque fluctuation amplitudes, depicted in Fig. 11b. The diagrams in Fig. 11c, d indicate that as the road adhesion coefficient increases, the longitudinal and vertical fluctuations of jerk also increase. At this moment, the roughness of the road significantly impacts the longitudinal and vertical jerk, particularly affecting the vertical jerk. Under the dry asphalt, gravel, and snow-covered (compacted) surfaces, the maximum vertical jerk of the vehicle upon completion of starting is 2.16 m/s3, 0.35 m/s3, and 0.21 m/s3, respectively. Furthermore, the suspension’s deformation generates high-amplitude, low-frequency shocks in both longitudinal and vertical directions, having a considerable influence on the vehicle’s comfort. As indicated in Fig. 11e, the coefficient of road adhesion significantly affects the longitudinal velocity during the starting process. As the road adhesion coefficient decreases, the longitudinal speed of the vehicle decreases. Figure 11f shows that a smaller road adhesion coefficient corresponds to a smaller slipping power of the clutch during the starting process.
The influence of road slope on the starting process of DCT vehicles
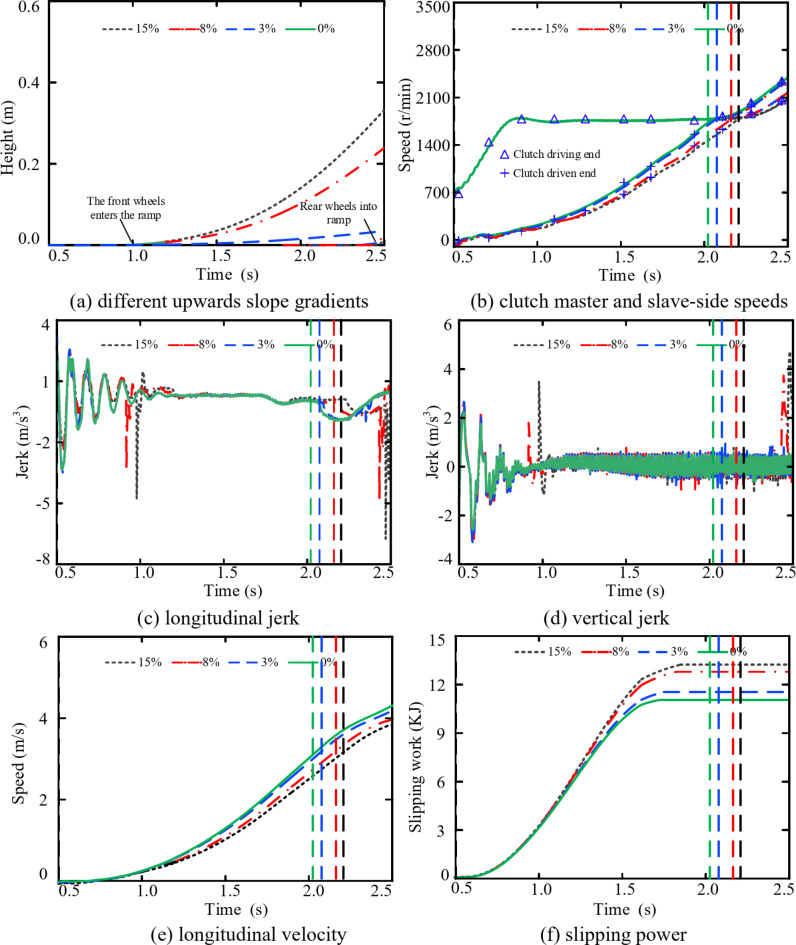
With gradients of 0%, 3%, 8%, and 15%, representing level ground (no gradient), a slight slope, a moderate slope, and a steep slope, respectively, the influence of a vehicle entering a sloped surface from a straight road is analysed. This study aimed to understand how different gradients affect the dynamic characteristics of the vehicle.
Figure 12a shows the heights of the front and rear wheels during uphill motion. Figure 12b indicates that as the slope increases during uphill motion, the slave-side speed of the clutch increases more slowly, leading to a longer starting time. Figure 12c, d show that when the vehicle’s front and rear wheels transition from a horizontal surface to an uphill ramp, there are significant and large-scale jerks in the longitudinal and vertical directions. Moreover, the greater the slope is, the more pronounced the fluctuations, leading to a more substantial adverse impact on the overall comfort. Simultaneously, fluctuations in engine output torque induce low-amplitude, high-frequency oscillations in both the longitudinal and vertical directions, with a greater influence on the vertical jerk magnitudes. With gradients of 15%, 8%, 3%, and 0%, the maximum vertical jerk of the vehicle upon completion of starting is 5.46 m/s3, 4.24 m/s3, 1.83 m/s3 and 1.36 m/s3, respectively. Figure 12e indicates that as the slope increases, the longitudinal velocity decreases. As shown in Fig. 12f, the gradient of the road significantly affects the sliding work of the clutch, with steeper slopes leading to increased sliding work during uphill driving.
Fig. 12.
Coupling effect of the uphill slope and internal excitation on the vehicle starting process.
Results and discussion
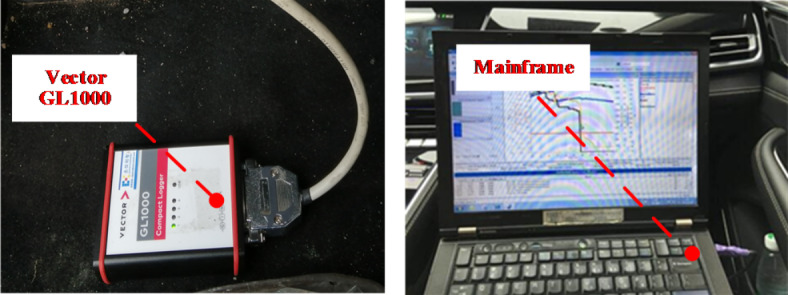
To verify the accuracy of the established coupling dynamics model that considers both internal and external excitations in analysing the dynamic characteristics of DCT vehicle’s starting, a DCT car equipped with a 1.5T turbocharged engine and a 7-speed DCT was used as the test object and tested in a professional automotive testing field. The basic parameters of the entire vehicle are shown in Table 1. A series of vehicle start-up tests were conducted in standard automotive testing facilities. The test vehicle underwent start-up tests in four different driving environments: dry asphalt straight road, randomly uneven road, 10% slope ramp, and wet road surface. To obtain high-quality data, a VECTOR GL1000 data acquisition device was used. This device reads vehicle driving data at a Highest sampling rate of 1 kHz. The diagram in Fig. 13 shows the test vehicle and the equipment for data acquisition. The simulation and experimental results for the vehicle under different driving conditions were analysed and validated. Various driving environments were selected for whole-vehicle tests, including a basic performance road with dry asphalt and a straight surface, a road with random surface roughness for stochastic excitation, a 10% gradient road, and a gravel road with different road adhesion coefficients. These tests aim to investigate the impact of various driving environments on the starting characteristics of DCT vehicles.
Table 1.
Basic parameters of vehicle.
| Parameter | Value |
|---|---|
| Vehicle quality (unloaded) | 1620 kg |
| Vehicle quality (full load) | 1995 kg |
| drag coefficient | 0.36 |
| Windward area of the vehicle body | 2.60 m2 |
| Tire rolling radius | 0.358 m |
| 1–7 gear ratios | [4.214, 3.105, 1.724, 1.268, 1.27, 1.049, 0.8917] |
| final drive ratios | [3.944, 3.227] |
Fig. 13.
Experimental Data Acquisition Equipment.
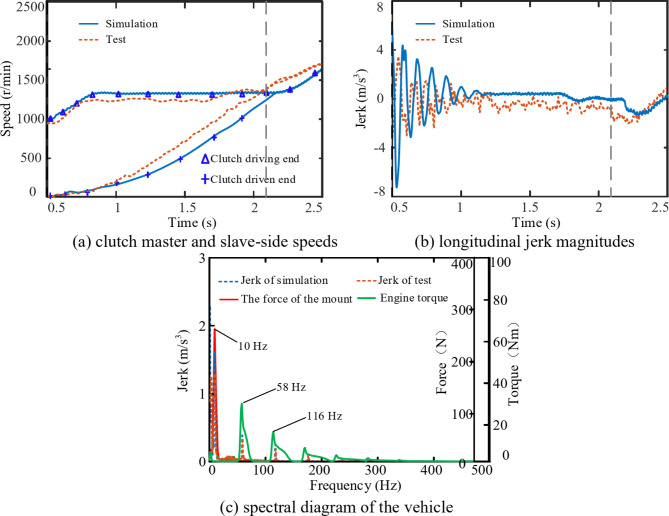
To validate the accuracy of the simulation results on the effects of road roughness on vehicle dynamic behaviour, the simulation outputs were compared against the experimental results. A vehicle starting under Class B random road excitation conditions was chosen as an example. The comparison is illustrated in Fig. 14, which shows the simulation and experimental results for the vehicle starting on a straight asphalt road. As shown in Fig. 14a, b, the overall trends of the clutch master and slave-side speeds, as well as the Longitudinal Jerk, are generally consistent between the simulation and experimentation. At the beginning of the experiment, both the simulation and experimentation show significant low-frequency impacts in the longitudinal direction. At the completion of the starting, the vehicle exhibits lower-amplitude and lower-frequency longitudinal jerk. Due to the difficulty in directly obtaining the engine output torque and the total force applied to the vehicle from suspension during the experimental process, the comparison between the experimental longitudinal jerk magnitudes and the simulation results, including the spectra of the longitudinal jerk, engine output torque, and suspension force, indirectly validate the factors influencing the overall impacts on the vehicle. A fast Fourier transform (FFT) was applied to the Longitudinal Jerk magnitudes during the startup phase, as well as to the simulated engine output torque and the forces applied to the vehicle from suspension. The corresponding frequency spectra are shown in Fig. 14c. There is a significant fluctuation at 10 Hz in the force applied to the vehicle from suspension, causing similar frequency and large-amplitude impacts in the longitudinal direction, negatively affecting the overall comfort during the startup phase. The main frequency of the engine output torque fluctuation is 58 Hz, and there is a corresponding impact frequency component in the longitudinal direction, but its amplitude is small, resulting in minimal impact on the overall NVH performance of the vehicle.
Fig. 14.
A comparative analysis of the experimental and simulation results in terms of the influence of flat and straight road surfaces on the starting conditions of DCT vehicles.
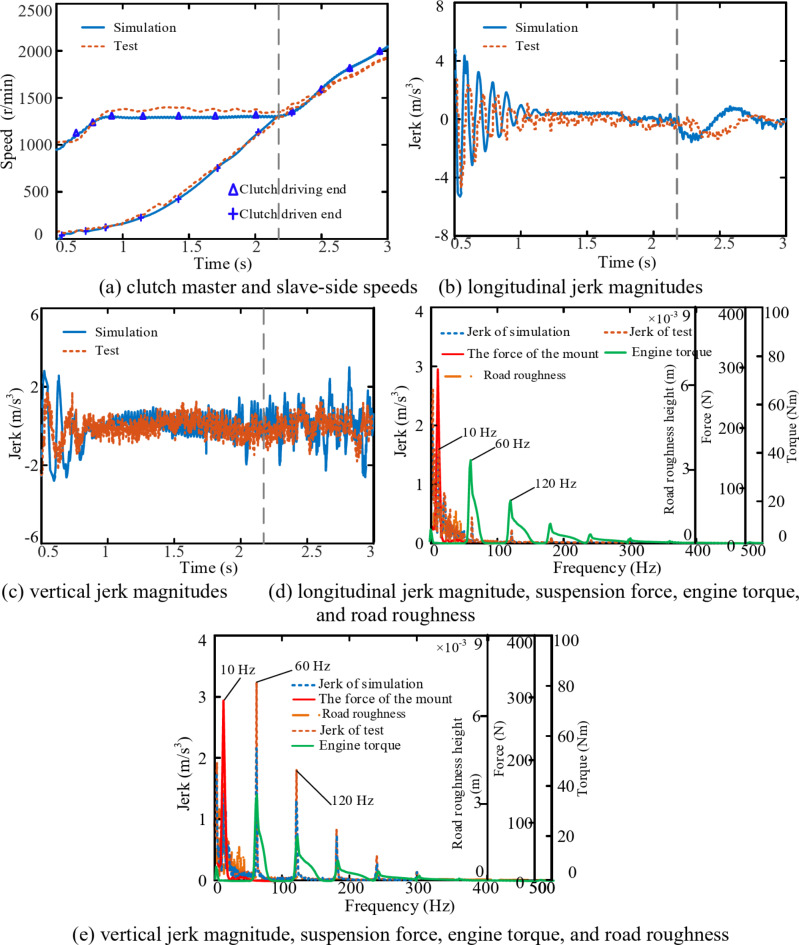
Figure 15 presents the simulation and experimental results for a vehicle starting on a Class B random uneven road surface. As shown in Fig. 15a, the trends in the clutch master and slave-side speeds are generally consistent between the simulation and experimentation. As shown in Fig. 15b, c, during the initial stage of starting, both the simulation and experimentation exhibit significant low-frequency oscillations and the jerk in both the longitudinal and vertical directions. Additionally, at the completion of the starting, both the simulation and experimentation show noticeable impacts in the longitudinal direction. Frequency spectrum analysis was conducted on the simulated engine output torque, road roughness, forces acting on suspension mounts, and the magnitude of the longitudinal and vertical jerk, as well as on the experimental longitudinal and vertical jerk magnitudes. The results are illustrated in Fig. 15d, e. The frequency of the torque fluctuation of the engine output includes 60 Hz and its harmonics, and the amplitude decreases with increasing frequency. Both the simulation and the experiment of the vehicle longitudinal and vertical jerk are consistent in terms of the frequency of the engine harmonic torque. In addition, the deformation of the mount causes large amplitude fluctuations of 10 Hz in the vehicle’s longitudinal and vertical movements. Random uneven road excitation causes impacts in the frequency range of 0–40 Hz in both the longitudinal and vertical directions of the vehicle.
Fig. 15.
A comparison of experimental and simulation outcomes in terms of the influence of the road roughness on the starting conditions of DCT vehicles.
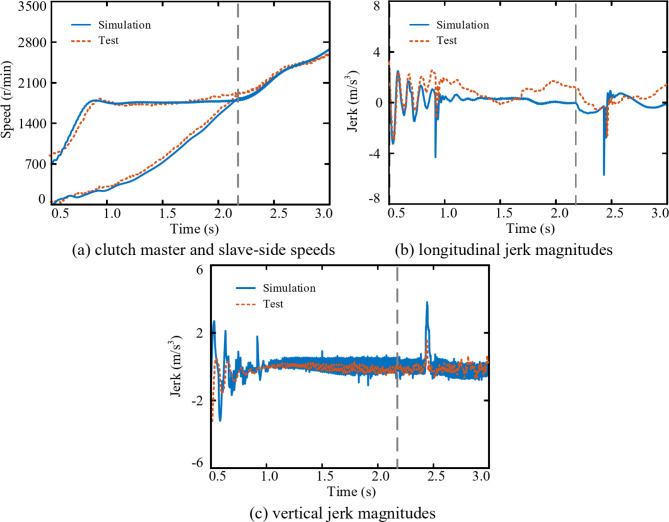
Figure 16 presents the simulation and experimental results for a DCT vehicle starting on a wet and slippery road surface. As shown in Fig. 16a–c, compared to those for the starting process on an asphalt road, the vehicle’s starting time and the longitudinal and vertical jerk magnitudes are significantly reduced. The trends of the clutch master and slave-side speeds in the simulation and experimentation are generally consistent. At the beginning of the starting, both the longitudinal and vertical directions exhibit significant impact magnitudes, and noticeable fluctuations are present at the completion of the starting.
Fig. 16.
A comparison of experimental and simulation outcomes in terms of the influence of the road adhesion coefficient on the starting conditions of DCT vehicles.
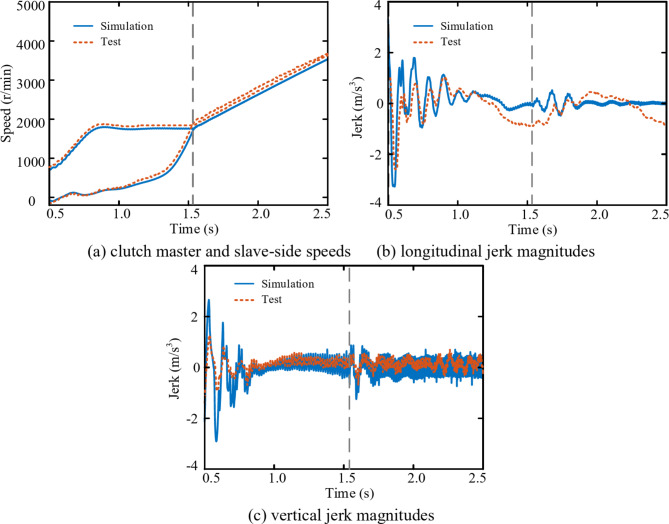
Figure 17 presents the simulation and experimental results for a DCT vehicle starting on an uphill slope with a gradient of 10%. As shown in Fig. 17a–c, the simulation and experimental results reflect significant longitudinal and vertical jerk in the vehicle when its front and rear wheels ascend the slope at 0.9 s and 2.4 s respectively. The trends in the clutch master and slave-side speeds, as well as the longitudinal and vertical jerk magnitudes, in both the simulation and experimentation are generally consistent. When the vehicle’s front and rear wheels enter an uphill slope, there is a significant impact both longitudinally and vertically.
Fig. 17.
A comparison of experimental and simulation outcomes in terms of the influence of the Road slope on the starting conditions of DCT vehicles.
In summary, to validate the accuracy of the whole-vehicle model considering internal and external excitation established in this study, simulation results were compared with experimental results under different driving environments and conditions. The overall trend of the simulation results closely aligns with the experimental results, indicating that the model accurately captures the dynamic characteristics of the vehicle’s starting process under varying conditions, thereby validating the correctness and rationality of the simulation model. Therefore, the whole-vehicle dynamic model established in this study, which considers both internal and external excitation, can be used for analysis and research on the longitudinal dynamic characteristics of DCT vehicles.
Conclusion
The DCT power transmission system is a complex nonlinear system, and existing research lacks in-depth consideration of the coupling effect of internal excitation and external excitation, such as the driving environment, on the starting dynamic characteristics of DCT vehicles. Therefore, effectively improving the starting dynamic performance of vehicles through the precise design of DCT transmission systems is impossible, resulting in a slow starting response, large transmission system vibration, and even impact problems for DCT vehicles. To improve the starting quality of DCT vehicles through the precise design of the transmission system, this work studies the influence of internal and external excitation coupling on the dynamic characteristics of DCT vehicles, providing theoretical and technical support for the parameter optimization design of key components of the DCT transmission system based on the research results presented in this paper. The study revealed that the driving environment significantly influences the vehicle’s starting performance. These research findings are crucial for improving vehicle performance, optimizing dynamic control systems, and enhancing driving safety. The specific research work and conclusions are as follows:
Road roughness significantly impacts both the longitudinal and vertical directions. The greater the road roughness is, the greater the magnitudes of both the longitudinal and vertical jerk, with more pronounced variations in the vertical direction. The roughness of the road surface has minimal effect on the vehicle’s starting time, but it can influence the slipping work of the clutch; The slipping work of the clutch increases with the roughness of the road surface.
The coefficient of road adhesion affects the starting of a vehicle. When it is low, the starting time decreases, but the longitudinal jerk amplitude is smaller. Simultaneously, the longitudinal velocity of the vehicle is also smaller. The coefficient of road adhesion has a significant impact on the slipping work of the clutch; the smaller the coefficient of road adhesion, the less the slipping work.
Road gradient significantly affects the starting time. As the incline increases during uphill conditions, the starting time increases, and the longitudinal velocity decreases. When the vehicle’s front and rear wheels come in contact with a slope from a flat road, significant impacts occur in both the longitudinal and vertical directions. The greater the incline is, the greater the jerk in both the longitudinal and vertical directions, and simultaneously, the greater the increase in the clutch slip work.
Acknowledgements
The authors are grateful for the financial support provided by the National Natural Science Foundation of China (No. 52302468), the Science and Technology Research Program of Chongqing Municipal Education Commission (Grant No. KJQN202300720). This work has been supported by The State Key Laboratory of Mechanical Transmission, Chongqing University, China.
Author contributions
Zheng Guo: Data curation, Formal analysis, Investigation, Methodology, Project administration, Resources, Software, Writing – original draft, Writing – review & editingAntai Li: Data curation, Formal analysis, Methodology, Software, Writing – review & editingJihao Feng: Conceptualization, Data curation, Formal analysis, Funding acquisition, Software, Validation, Visualization, Writing – review & editingYongqiang Zheng: Data curation, Formal analysis, Investigation, Methodology, Resources, Supervision, Validation, Writing – review & editingDatong Qin: Conceptualization, Data curation, Investigation, Supervision, Validation, Visualization, Writing – review & editingShuaishuai Ge: Data curation, Formal analysis, Investigation, Methodology, Software, Supervision, Visualization, Writing – review & editing.
Data availability
All relevant data are within the paper. Data will be made available on request, and the corresponding author Zheng Guo can be contacted via email zhengguo@swu.edu.cn.
Declarations
Competing interests
The authors declare no competing interests.
Footnotes
Publisher’s note
Springer Nature remains neutral with regard to jurisdictional claims in published maps and institutional affiliations.
References
- 1.Putra, T. E. & Husaini, M. M. N. Predicting the fatigue life of an automotive coil spring considering road surface roughness. Eng. Fail. Anal.116, 104722 (2020). [Google Scholar]
- 2.Chca, B. et al. Durability assessment of suspension coil spring considering the multifractality of road excitations. Measurement. 158, 107697 (2020). [Google Scholar]
- 3.De Zepeda, M. V. N. et al. Dynamic clustering analysis for driving styles identification. Eng. Appl. Artif. Intell.10, 97 (2020). [Google Scholar]
- 4.Zhang, J. & Qi, H. Intelligent driving model considering vehicular dynamics and heterogeneous road environments. Transp. Lett. 1–16 (2024).
- 5.Chca, B. et al. Durability assessment of suspension coil spring considering the multifractality of road excitations. Measurement 158. (2020).
- 6.Xu, R. Research on Control Algorithm and key Problem of Tranction Control System on Complicated Working Condition (Tsinghua University, 2017).
- 7.He, L. et al. Control strategy for vibration suppression of a vehicle multibody system on a bumpy road. Mech. Mach. Theory174 104891 (2022).
- 8.Pisaturo, M. & Senatore, A. Thermal compensation control strategy in automated dry clutch engagement dynamics and launch manoeuvre. Int. J. Autom. Technol.20(6), 1089–1101 (2019). [Google Scholar]
- 9.Zhao, P. Research on Intelligent Gear Decision Making of Dual Clutch Transmissions Based on Driving Intention and Driving Environment Identification (Chongqing University, 2020).
- 10.Wei, H. et al. Bifurcation analysis of vehicle shimmy system exposed to road roughness excitation. J. Vib. Control. 28(9–10), 1045–1056 (2022). [Google Scholar]
- 11.Wedig, W. V. Turbulent travel speeds in nonlinear vehicle dynamics. Nonlinear Dyn.100(1), 147–158 (2020). [Google Scholar]
- 12.Wei, H. et al. Hopf bifurcation and energy transfer of automobile shimmy system with consideration of road roughness excitation. Veh. Syst. Dyn. 1–16 (2020).
- 13.Jozef, M. & Kuchárová, D. Numerical simulation of vehicle response on road profile quality. Int. Conf. Numer. Anal. Appl. Math.2116(1), 13–18 (2018).
- 14.Wei, H., Lu, J., Shi, L., Lu, H. & Ye, S. Modal analysis and dynamic shimmy behaviour of vehicle-road system. J. Vib. Control 1–13 (2021).
- 15.Fu, S., Luo, S. & Huang, H. Analysis of transmission box vibration characteristics under random road torsional excitation. Proc. Inst. Mech. Eng. Part D 236(12), 2582–2597 (2022).
- 16.Blekhman, I. & Kremer, E. Vibrational resistance to vehicle motion due to road unevenness. J. Sound Vib.405, 306–313 (2017). [Google Scholar]
- 17.Blekhman, I. & Kremer, E. Vertical-longitudinal dynamics of vehicle on road with unevenness. Procedia Eng.199, 3278–3283 (2017). [Google Scholar]
- 18.Wu, J. et al. Vehicle active steering control research based on two-DOF robust internal model control. Chin. J. Mech. Eng.29 (4), 1–8 (2016). [Google Scholar]
- 19.Li, L. et al. A novel fuzzy logic correctional algorithm for traction control systems on uneven low-friction road conditions. Veh. Syst. Dyn.53(6), 711–733 (2015). [Google Scholar]
- 20.Ahn, C., Peng, H. & Eric, T. H. Robust estimation of road friction coefficient using lateral and longitudinal vehicle dynamics. Veh. Syst. Dyn.50, 961–985 (2012). [Google Scholar]
- 21.Hu, J., Rakheja, S. & Zhang, Y. Real-time estimation of tire–road friction coefficient based on lateral vehicle dynamics. Proc. Inst. Mech. Eng. Part. D 234(10–11), 215–236 (2020). [Google Scholar]
- 22.Peng, Y., Chen, J. & Ma, Y. Observer-based estimation of velocity and tire-road friction coefficient for vehicle control systems. Nonlinear Dyn.96(1), 363–387 (2019). [Google Scholar]
- 23.Zhao, Y. Q. et al. Estimation of road friction coefficient in different road conditions based on vehicle braking dynamics. Chin. J. Mech. Eng.30(4), 982–990 (2017). [Google Scholar]
- 24.Liu, K., Yamamoto, T. & Morikawa, T. Impact of road slope on energy consumption of electric vehicles. Transp. Res. Part. D 54(6), 74–81 (2017). [Google Scholar]
- 25.Feng, J. Research on Intelligent Control of DCT Vehicles Considering Driving Behaviour and Driving Environment (Chongqing University, 2022).
- 26.Meng, F. & Jin, H. Slope shift strategy for automatic transmission vehicles based on the road slope. Int. J. Autom. Technol.19(3), 509–521 (2018). [Google Scholar]
- 27.Crowther, A. R. et al. Impulsive response of an automatic transmission system with multiple clearances: Formulation, simulation and experiment. J. Sound Vib.306(3–5), 444–466 (2007). [Google Scholar]
- 28.Li, R. & Wang, J. Dynamics of Gear Systems (Science, 1997).
- 29.Guo, R. & Zhang, T. Automobile Engine Mounting System (Tongji University Press, 2013)
- 30.Rogério, L., Farahani, B. V., de Melo, F. Q., Ramos, N. V. & Moreira, P. M. G. P. Dynamic modal analysis of a passenger bus: Theoretical and numerical studies. Transp. Res. Rec.2675(12), 264–279 (2021).
- 31.Duan, H. et al. Review on road roughness research. J. Vib. Shock28(9), 95–101 (2009). [Google Scholar]
- 32.Duan, H. et al. Review on road spectrum measurement and detection technology. J. Electron. Meas. Instrum.24 (1), 72–79 (2010). [Google Scholar]
- 33.Yu, Z. Theory of Automobiles (5th Edition) 93–94 (China Machine Press, 2009).
- 34.Zheng, G., Qin, D., Li, A., Feng, J. & Liu, Y. Analysis of the influence of a powertrain mounting system on a dual-clutch transmission vehicle under typical working conditions. Appl. Sci.12(15), 7439–7456 (2022). [Google Scholar]
Associated Data
This section collects any data citations, data availability statements, or supplementary materials included in this article.
Data Availability Statement
All relevant data are within the paper. Data will be made available on request, and the corresponding author Zheng Guo can be contacted via email zhengguo@swu.edu.cn.


