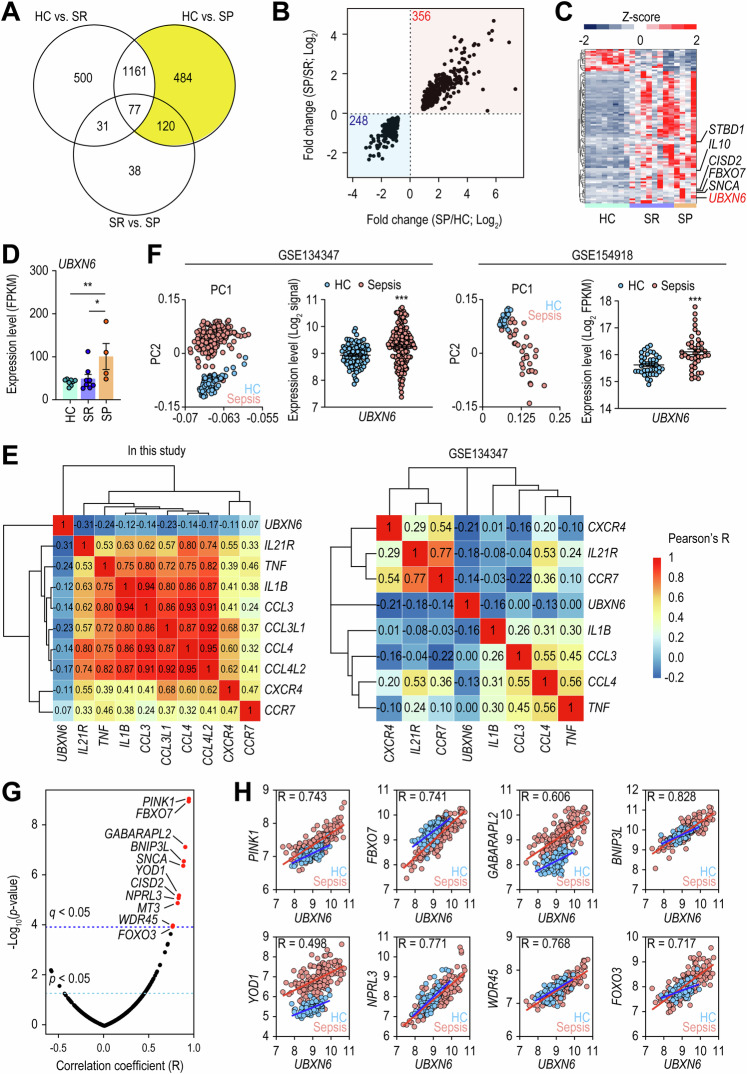
Fig. 1.
Compared with healthy controls, sepsis patients presented upregulated expression levels of UBXN6. A Diagram illustrating the number of DEGs identified by comparing HCs to SRs, HCs to SPs, and SRs to SPs. The yellow region highlights DEGs whose expression varies between HCs and SPs but not between HCs and SRs. B Graph depicting the fold changes in 604 genes from the yellow area of (A), with red indicating upregulated DEGs and blue indicating downregulated DEGs in SP. C Heatmap representing 91 ATG genes with differential expression. Hierarchical clustering of DEGs was performed on the basis of the Euclidean distance of relative expression. D Expression of UBXN6 in human PBMCs from HCs, SRs, and SPs in our cohort. *q value < 0.05, **q value < 0.01. E Gene expression correlations between UBXN6 and several inflammatory genes identified in our cohort and the publicly available GSE134347 dataset. The correlation coefficients are clustered hierarchically via the Euclidean distance method. F Principal component analysis of data from two publicly available cohorts, GSE134347 and GSE154918. The expression patterns of UBXN6 between HCs and sepsis patients within these cohorts are depicted. For GSE134347, microarray data were used, with log2-transformed signal intensities employed as expression levels. For GSE154918, RNA-seq data were used, with log2-transformed FPKM values representing expression levels. G Correlation test results for UBXN6 and 499 ATG genes. The 11 genes marked with red dots have a positive correlation with a statistically significant adjusted p value (q value) with a Bonferroni correction of less than 0.05. H Expression levels (log2-signal) and correlation values of UBXN6 and the 8 ATG genes in the GSE134347 cohort. The blue and red lines represent linear regressions for HCs and sepsis patients, respectively. The Pearson correlation coefficient (R) between the UBXN6 expression level and each gene was estimated via the correlation function implemented in R. All correlation tests yielded p values less than 2.2 × 10⁻¹⁶. HC, healthy controls; SP, patients with a poor prognosis; SR, patients who had recovered; FPKM, fragments per kilobase of transcript per million mapped reads. *p < 0.05, **p < 0.01, and ***p < 0.001

