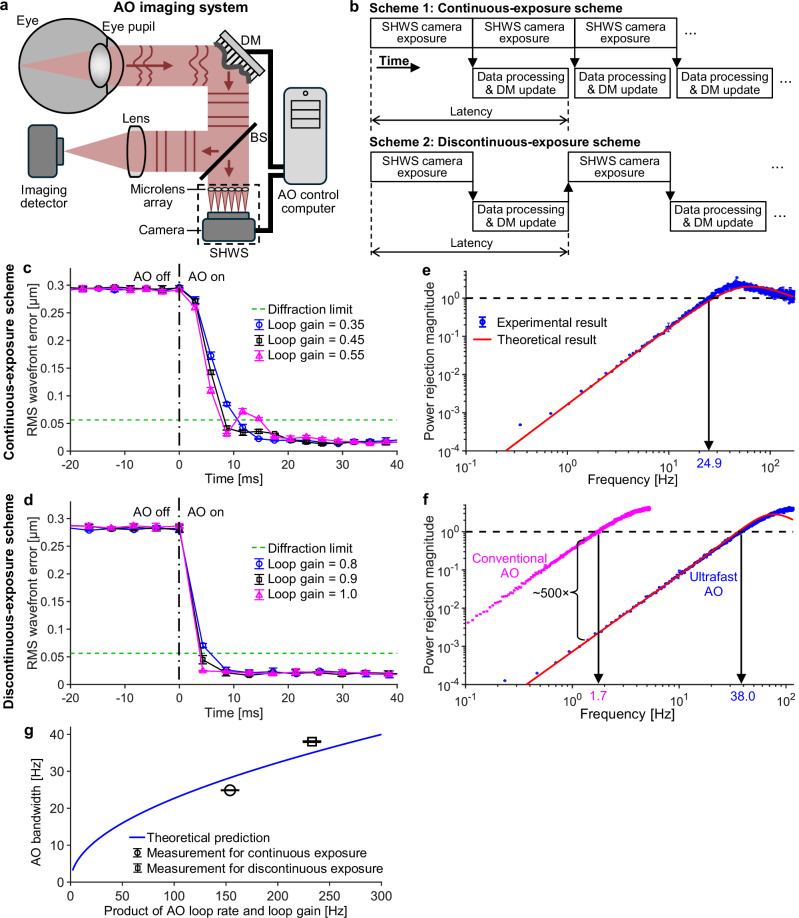
Fig. 1. Comparison of two fundamental AO operational schemes and their temporal performances.
a Illustration of a closed-loop AO system. Illumination path, relay optics, and scanners are omitted. Eye pupil is conjugate with DM and SHWS microlens array. BS beamsplitter; DM deformable mirror; SHWS Shack-Hartmann wavefront sensor. b Timing diagrams for the two AO operational schemes. RMS wavefront error over time before and after AO was turned on (at time 0) to correct a model eye aberration for continuous exposure (c) and discontinuous exposure (d), respectively. Different loop gains were tested to determine the optimal value. The power rejection curve when the AO ran at the optimal loop gain for the continuous- (e) and discontinuous-exposure (f) scheme, respectively. In (f), the power rejection curve of conventional AO is also shown for comparison with that of ultrafast AO. The theoretical curves shown in (e) and (f) are calculated using Eq. (1). Error bars and their centers in (c)−(f) represent the standard deviation and mean of three measurements, respectively. Most error bars are smaller than the markers. g AO bandwidth is a monotonically increasing function of the rate-gain product, as shown by the blue curve calculated from Eq. (2). Markers denote experimental results. Error bars and their centers represent the standard deviation and mean of three measurements, respectively.

