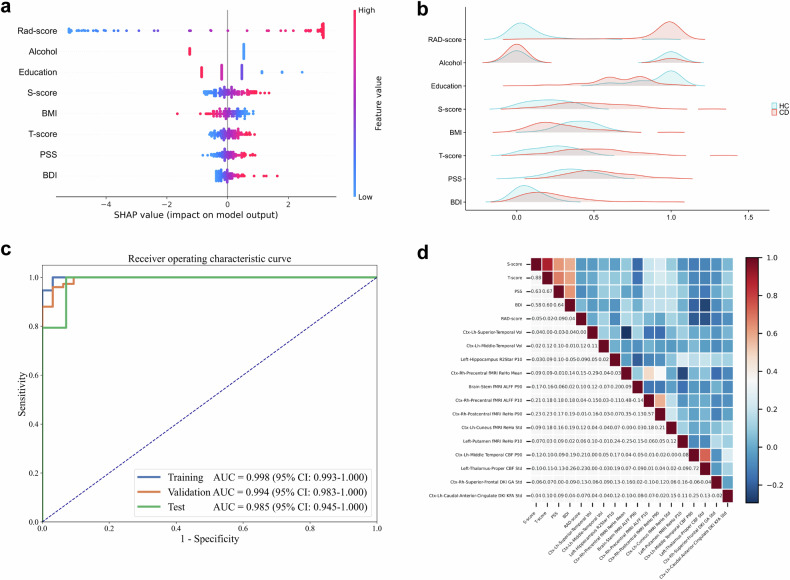
Fig. 3.
Development and assessment of a comprehensive brain-psychological-clinical model. a The SHAP summary plot of the comprehensive brain-psychological-clinical model (visual interpretation of the comprehensive model). The rad-score emerged as the most prominent determinant in the comprehensive model, surpassing all other clinical and psychological factors (see Table 3). SHAP plot illustrating the eight features used to develop brain-psychological-clinical model. The importance of the eight features is demonstrated in descending order. The horizontal location in the SHAP plot indicates whether the effect of that value is associated with a higher or lower prediction, and the color represents the level of that variable (high = red; low = blue) for that observation. Each dot represents a single sample. The height of the dots reflects the number of samples. b The ridge plots show the data distributions of these eight features in CD patients and HCs of the comprehensive model. Other detailed statistical information is shown in Table 3. c ROC curve of the comprehensive model for distinguishing CD patients from HCs. d Heatmap showing correlations among the 13 brain radiomics features, the rad-score, and the four psychological assessment scores. (rad-score, radiomics score; S, state score of the State-trait Anxiety Inventory, T, trait score of the State-trait Anxiety Inventory; BMI, body mass index; PSS, score on the Perceived Stress Scale; BDI, score on the Beck Depression Inventory; SHAP, Shapley Additive Explanations; CD, Crohn’s disease; HCs, healthy controls; p10, 10th percentile; fMRI, functional MRI; ctx, cortex; ReHo, regional homogeneity; DKI, diffusion kurtosis imaging; KFA, kurtosis fractional anisotropy; std, standard deviation; CBF, cerebral blood flow; p90, 90th percentile; vol, volume; ALFF, amplitude of low-frequency fluctuations; DKI, diffusion kurtosis imaging; GA, geodesic anisotropy; AUC, area under the ROC curve; CI, confidence interval)

