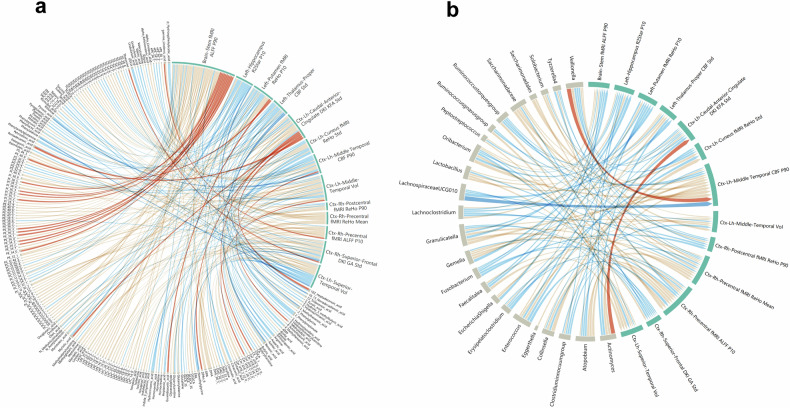
Fig. 5.
Chord diagram displaying the relationships among blood metabolites, brain radiomics features, and CD-enriched genera. a The chord diagram illustrates the relationships between 137 blood metabolites and thirteen brain features of CD patients, as determined through linear regression analysis adjusting for age, sex, and body mass index. The width of each arc on the circumference reflects how frequently a variable shows significant correlations with others, while also considering the correlation coefficient. The latter is also shown through variations in string thickness and color intensity; thicker strings indicate stronger correlations, while redder colors indicate positive correlations and bluer colors indicate negative correlations (see Supplementary Table 7). b The chord diagram illustrates the relationships between 24 CD-enriched genera and 13 brain features of CD patients determined through linear regression analysis adjusting for age, sex, and body mass index (see Supplementary Table 9). (AMP, adenosine monophosphate; CA, cholic acid; CDCA, chenodeoxycholic acid; CE, cholesteryl ester; CER, ceramide; DAG, diacylglycerol; DHA, docosahexaenoic acid; DPA, docosapentaenoic acid; EPA, eicosapentaenoic acid; GCDCA_s, glycochenodeoxycholic acid sulfate; LPC, lysophosphatidylcholine; LPE, lysophosphatidylethanolamine; PC, phosphatidylcholine; PE, phosphatidylethanolamine; PI, phosphatidylinositol; PS, phosphatidylserine; UDCA, ursodeoxycholic acid; SM, sphingomyelin; TAG, triacylglycerol; bUDCA, 3β-ursodeoxycholic acid; DAG, diacylglycerol; SM, sphingomyelin; ctx, cortex; vol, volume; p10, 10th percentile; fMRI, functional MRI; ReHo, regional homogeneity; ALFF, amplitude of low-frequency fluctuations; p90, 90th percentile; std, standard deviation; p10, 10th percentile; CBF, cerebral blood flow; DKI, diffusion kurtosis imaging; GA, geodesic anisotropy; KFA, kurtosis fractional anisotropy)

