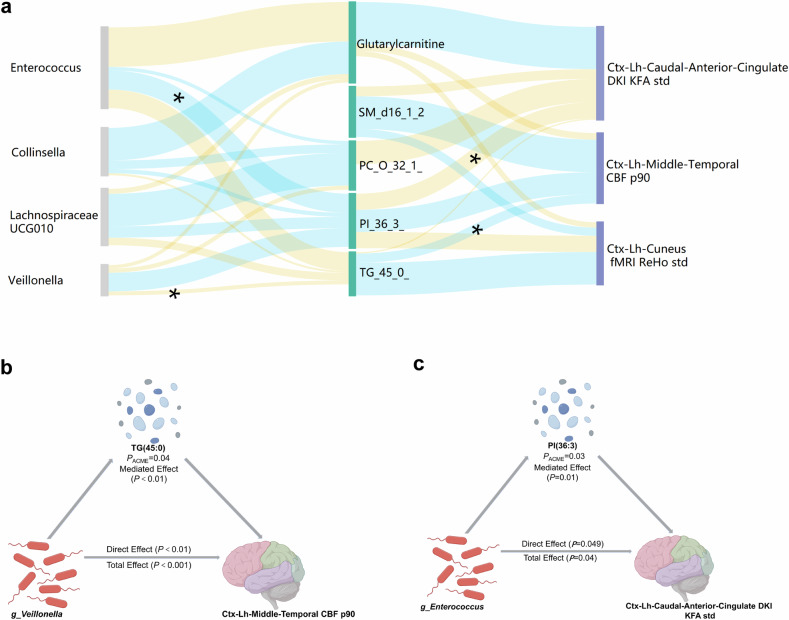
Fig. 6.
Putative links among alterations in the gut microbiota, blood metabolites, and the brain of CD patients. a Sankey plot indicating microbial genera contributing to brain radiomics features in patients with CD, mediated by blood metabolites. All p-values of average causal mediation effects are either below 0.05 (*p < 0.05) or approaching it (p = 0.052–0.066). The height of the column reflects the sum of the related features and the absolute value of its correlation coefficient. The width of each band represents the correlation coefficient value, and the wider the band is, the greater the correlation coefficient. Yellow indicates a positive correlation, and blue indicates a negative correlation. b Illustration of the association between g_Veillonella and brain features (i.e., Ctx-Lh-Middle-Temporal CBF p90) mediated by TAG (45:0) in CD patients (pACME = 0.038). c Illustration of the association between g_Enterococcus and brain features. (Ctx-Lh-Caudal-Anterior-Cingulate-DKI-KFA std) in CD patients (pACME = 0.026). (ACME, average causal mediation effects; TAG, triacylglycerol; g, genus; ctx, cortex; lh, left head; CBF, cerebral blood flow; p90, 90th percentile; PI, phosphatidylinositol; g, genus; DKI, diffusion kurtosis imaging; KFA, kurtosis fractional anisotropy; std, standard deviation)

