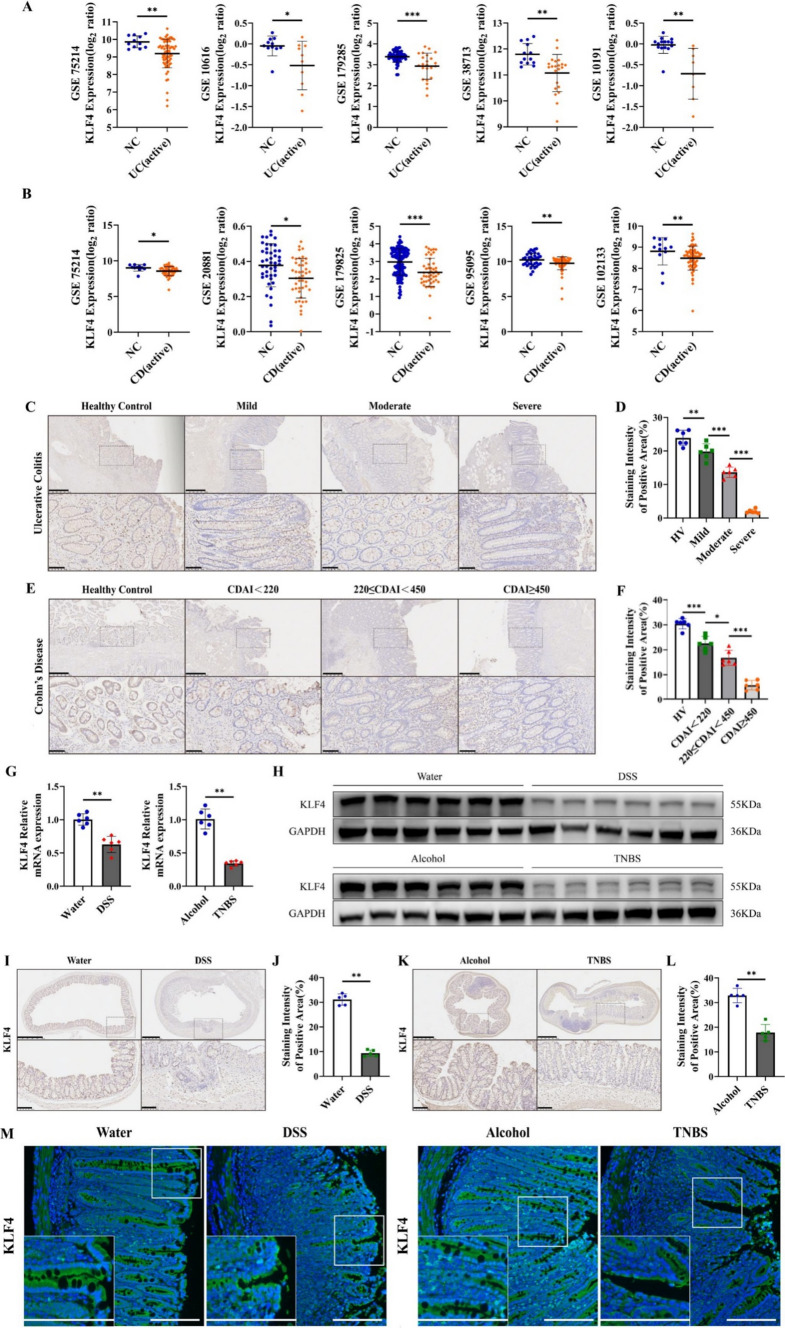
Fig. 1.
KLF4 expression is downregulated in IBD patients and colitis model mice. A, B KLF4 transcript expression data were obtained from eight different GSE datasets, as indicated. All the datasets showed significantly reduced KLF4 mRNA expression in the IBD patients than in the negative controls. The UC GEO datasets used were GSE75214 [11 NC (healthy individuals), 74 active]; GSE10616 [11 NC (healthy individuals), 10 active]; GSE179285 [55 NC (healthy individuals and inactive adjacent regions), 23 active]; GSE38713 [13 NC (healthy individuals), 22 active]; and GSE10191 [15 NC (healthy individuals and inactive adjacent regions), 8 active]. The CD GEO datasets used were GSE75214 [11 NC (healthy individuals), 51 active], GSE20881 [44 NC (healthy individuals), 44 active], GSE95095 [36 NC (healthy individuals and inactive adjacent regions), 24 active], GSE102133 [12 NC (healthy individuals), 65 active] and GSE179285 [129 NC (healthy individuals and inactive adjacent regions), 47 active]. C Representative IHC images of KLF4 protein expression in colon tissues from healthy controls and patients with different stages of UC. Scale bars, 500 μm (top) and 100 μm (bottom). D The staining intensity of KLF4 in colon tissues from healthy controls and patients with different stages of UC, as determined by the staining index. (healthy control, n = 6; mild, n = 6; moderate, n = 6; severe, n = 6). E Representative IHC images of KLF4 protein expression in small intestine tissues from healthy controls and patients with different stages of CD. Scale bars, 500 μm (top) and 10 μm (bottom). F The staining intensity of KLF4 in small intestine tissues from healthy controls and patients with different stages of CD (healthy controls, n = 6; CDAI < 220, n = 6; 220 ≤ CDAI < 450, n = 6; CDAI ≥ 450, n = 6). G, H The mRNA (G) and protein (H) expression of KLF4 in DSS-induced (water, n = 6 and DSS, n = 6) and TNBS-induced (alcohol, n = 6; TNBS, n = 6) colitis mice was examined by RT‒qPCR and Western blot. I, J KLF4 protein expression in DSS-induced colitis mice was measured by IHC. Scale bars, 500 μm (top) and 100 μm (bottom). The staining intensity of KLF4 in DSS-induced colitis mice (water, n = 5; DSS, n = 5) was determined based on the IHC staining index. K, L The protein expression of KLF4 in TNBS-induced colitis mice was detected by IHC. Scale bars, 500 μm (top) and 100 μm (bottom). The staining intensity of KLF4 based on the IHC staining index in TNBS-induced colitis mice (alcohol, n = 6; TNBS, n = 6). M Representative immunofluorescence micrographs showing KLF4 (green) expression in colon biopsy specimens from DSS-induced (left) and TNBS-induced (right) colitis mice. Scale bars, 100 μm. The data are expressed as the mean ± SD. * p < 0.05, ** p < 0.01, *** p < 0.001

