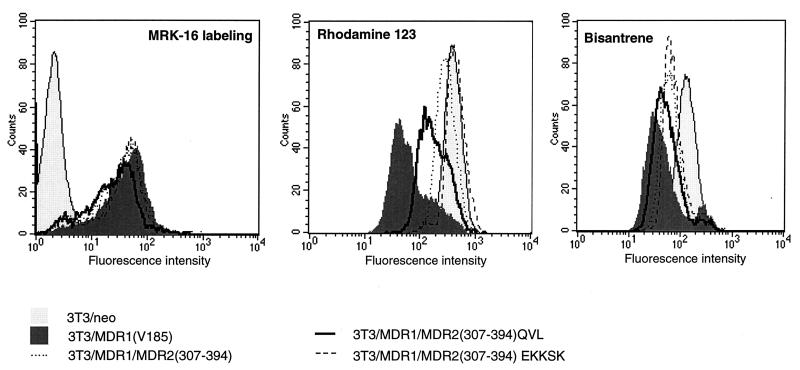
FIG. 3.
Expression and function of MDR1-MDR2 chimeras after stable transfection. (A) The cell surface expression of MDR1, MDR1-MDR2(307–394), and its mutants on transfected 3T3 cells was determined by using MRK-16 antibody labeling and FACS analysis. The transporter activity of MDR1, MDR1-MDR2(307–394), and its mutants was analyzed by using a fluorescent substrate accumulation assay. The 3T3 cells expressing MDR1 or its mutants were incubated in medium containing 1 μg of bisantrene per ml (B) or 0.5 μM rhodamine-123 (C) at 37°C for 60 min. The fluorescence intensity, representing the intracellular accumulated substrate, was detected by FACS. Key: light gray areas, 3T3/neo; dark gray areas, 3T3/MDR1(V185); dotted line, 3T3/MDR1-MDR2(307–394); heavy line, 3T3/MDR1

