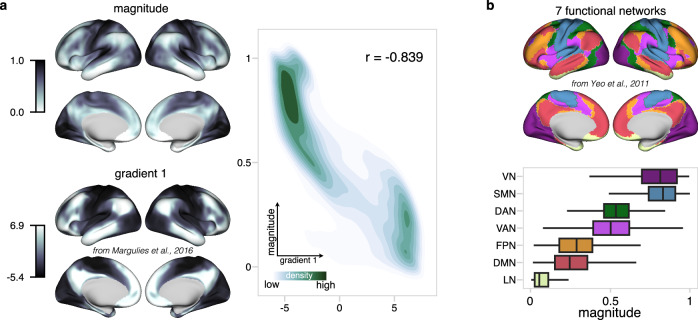
Fig. 3. Sensory magnitude and cortical hierarchy.
a Left column shows surface mappings of sensory magnitude under movie-watching condition and the principal connectome gradient under resting-state condition8. The right density illustrates the relationship between sensory magnitude and principal gradient values. b The boxplot illustrates the network-wise distribution of the magnitude values based on a 7-network parcellation24. For the boxplot, the middle line represents the median, while the box’s upper and lower limits correspond to the 75th and 25th percentiles, respectively. The whiskers extend up to 1.5 times the interquartile range from the upper and lower box limits. Note the striking topographical consistency between the magnitude map and the principal gradient map, despite methodological difference, indicating converging evidence.

