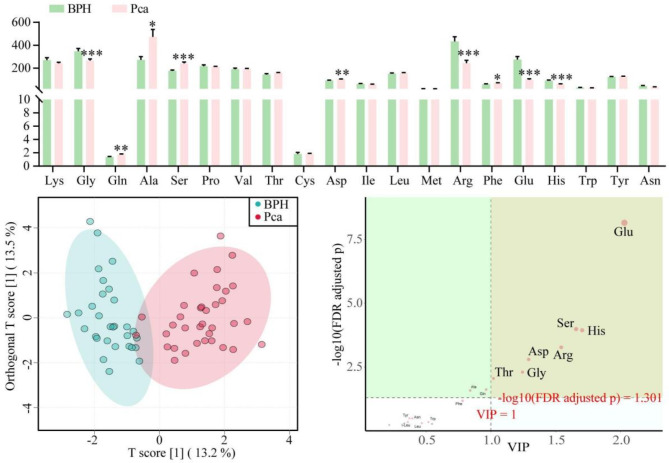
Fig. 2.
Comparison of UPLC-MS/MS-based amino acid profiles between the BPH group and the PCa group reveals significant differences. A Comparison of serum AA concentrations between the BPH group and the PCa group, analyzed using the Mann-Whitney U test. Significant differences were observed for specific AAs, as indicated by *P < 0.05, ***P < 0.001. B OPLS-DA score plot illustrating the discrimination between serum AA profiles from the BPH group (blue) and the PCa group (red). C VIP scores derived from the OPLS-DA model, showing the importance of serum AAs in distinguishing between the two groups (VIP > 1 was considered significant). Sample sizes were n = 30 for the BPH group and n = 35 for the PCa group.

