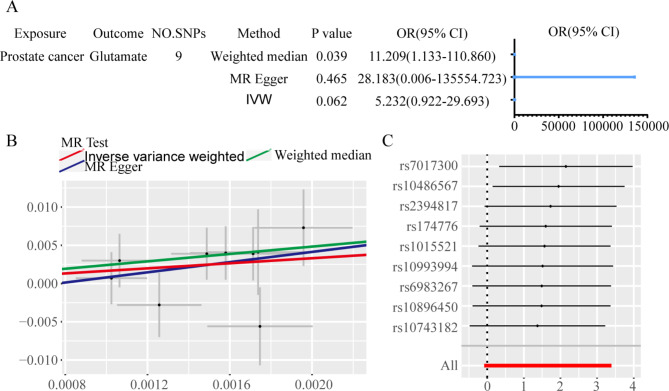
Fig. 4.
Two-sample MR analysis results reveals the association between Glu levels and PCa risk. A Forest plot displaying MR estimates and 95% confidence intervals for the causal effect of Glu levels on PCa risk. B Scatter plot depicting the relationship between genetically predicted Glu levels and the risk of PCa using different MR methodologies (inverse-variance weighted, MR-Egger, and weighted median). C Leave-one-out sensitivity analysis indicating the stability of the association between Glu and PCa risk, demonstrating that no single SNP disproportionately influenced the results.

