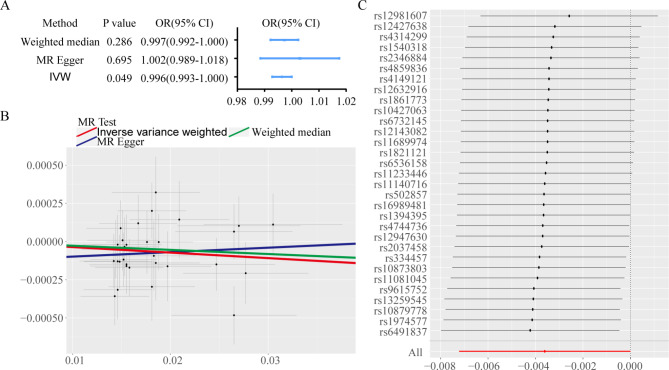
Fig. 5.
Reverse MR analysis reveals the association between PCa as exposure and Glu as outcome. A Forest plot illustrating MR estimates and corresponding 95% CI values for the causal effect of PCa as an exposure on Glu levels. B Scatter plot showing the relationship between genetically predicted PCa levels and Glu concentrations using different MR approaches. C Leave-one-out sensitivity analysis for the reverse MR analysis, confirming the robustness of the findings by demonstrating minimal influence from individual SNPs.

