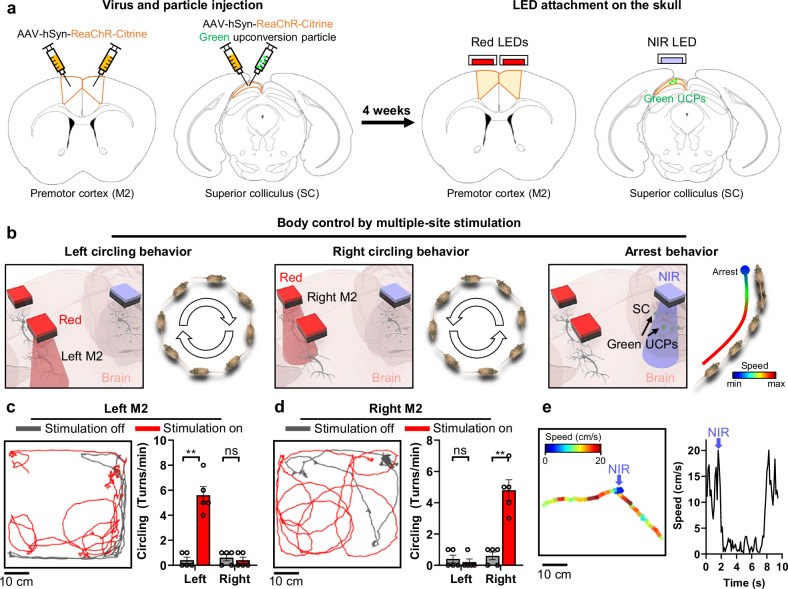
Fig. 3. Selective, multi-site neuromodulation and monitoring of behavioral changes.
a The schematic diagrams of virus/particle injection and LED attachment to the skull. ReaChR virus was injected into the left/right premotor cortex (M2) and superior colliculus (SC). The green upconversion particles were injected into the SC. After 4 weeks, two Red LEDs and one NIR LED were attached above the left/right M2 and SC regions. b Schematic diagrams for behavioral modulation (i.e., left/right circling behaviors (10 Hz, 10 ms ON time) and arrest behavior (1 time, 20 ms ON time)) by selective, multi-site neuromodulation. c Representative trajectory and comparison of the number of left or right circling behaviors per minute according to local neuromodulation off and on for left M2 neurons (Left: p = 0.0079, Right: p > 0.9999; n = 5 mice.). d Representative trajectory and comparison of the number of left or right circling per minute according to local neuromodulation off and on for right M2 neurons (Left: p > 0.9999, Right: p = 0.0079; n = 5 mice.). e Speed change by local neuromodulation of SC neurons. Blue arrow indicates the timing of NIR light on. The data are presented as mean values ± s.d. All statistical analyses were performed using the two-tailed Mann-Whitney test, and p < 0.05 was considered significant. **p < 0.01. ns: no statistical significance.

