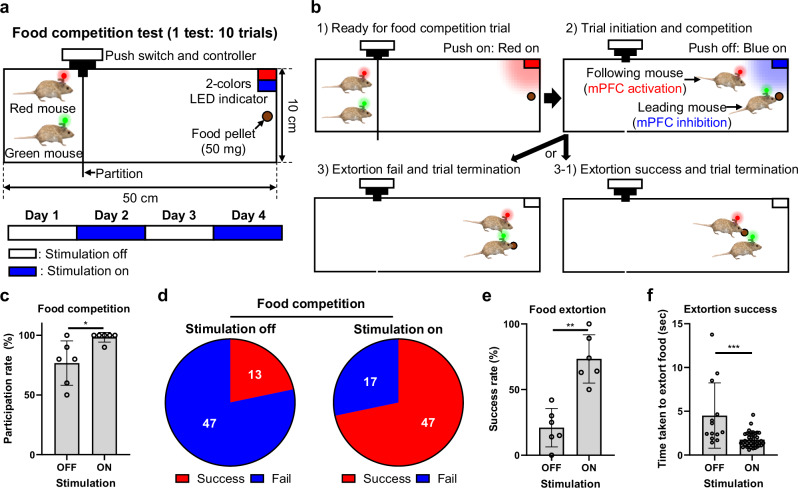
Fig. 5. Modulation of extorting behaviors in food competition test.
a Schematic illustration showing the experimental setup for the food competition test. One test consisted of 10 trials. The test was performed for 4 days. b Schematic illustrations showing the experimental protocol for one trial in the food competition test. c Comparison of participation rate according to stimulation off and on (10 Hz, 10 ms ON time) in 3 mice pairs (p = 0.0281; white circle: n = 6 tests per pair.). d The number of extortion success or fail according to stimulation off and on. e Comparison of success rate of food extortion according to stimulation off and on from 3 mice pairs (p = 0.0022; white circle: n = 6 tests per pair.). f Comparison of time taken to extort food according to stimulation off and on in extortion success trials (p = 0.0001; white circle: n = 13 (stimulation off) n = 46 where n is the number of successful extorting trials from 3 mice pairs.). The data are presented as mean values ± s.d. with individual data points. All statistical analyses were performed using the two-tailed Mann-Whitney test, and p < 0.05 was considered significant. *p < 0.05, **p < 0.01, ***p < 0.001. ns: no statistical significance.

