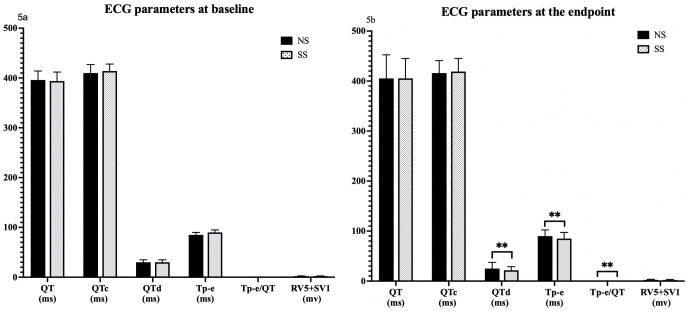
Fig. 5.
Differential impact of salt substitution on ECG parameters at study baseline and endpoints. Comparison of ECG parameters (QT, QTc, QTd, Tp-e, Tp-e/QT, RV5+SV1) between NS and SS groups at baseline (5a) and the endpoint (5b). ** p 0.001. NS, normal salt; SS, salt substitution; ECG, electrocardiogram; QT, QT interval; QTc, corrected QT interval; QTd, QT dispersion; Tp-e, T wave peak-to end; RV5+SV1, sum of the amplitudes of the R wave in lead V5 and the S wave in lead V1.

