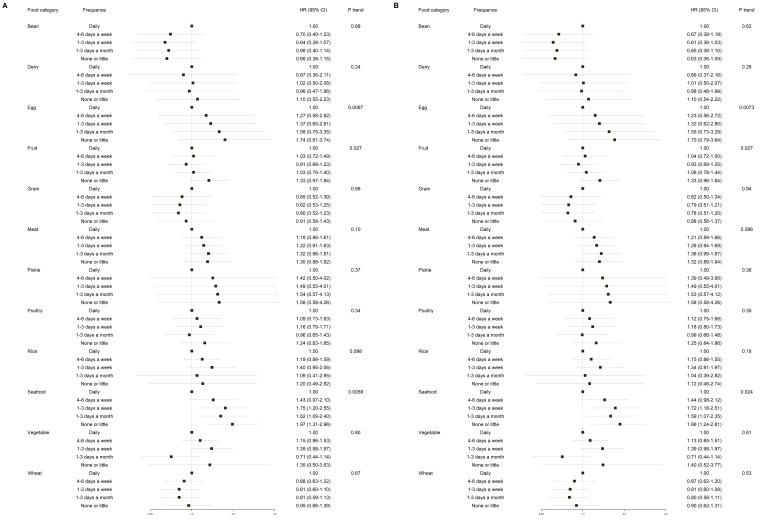
Fig. 3.
Forest plots of adjusted hazard ratios for associations between food consumption and CVD events in the training cohort. (A) model 1: adjusted for age, sex, and center as a random effect. (B) model 2: adjusted for age, sex, alcohol, location, smoke, education, BMI, LDL, HDL, TC, hr, DBP, SBP, and center was also included as a random effect. Confidence intervals are 95%. Abbreviations: CVD, cardiovascular disease; BMI, body mass index; DBP, diastolic blood pressure; SBP, systolic blood pressure; hr, heart ratio; TC, total cholesterol; LDL, low-density lipoprotein; HDL, high-density lipoprotein.

