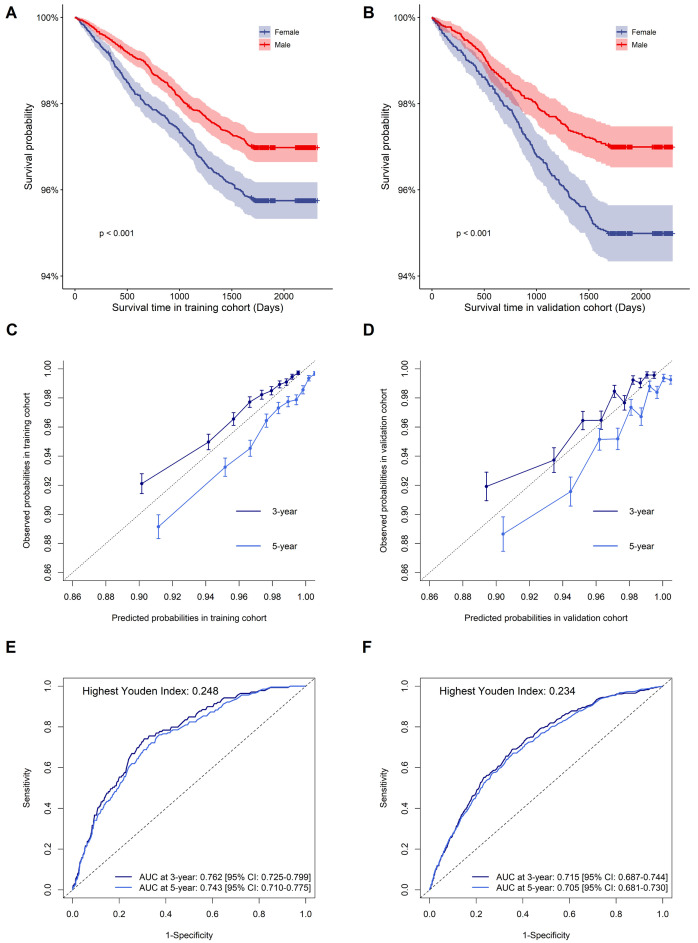
Fig. 5.
The survival curve, calibration plot, and time-dependent ROC curve of the nomogram in the training and validation cohorts. (A,B) Kaplan-Meier survival for the incidence of CVD between males and females in the training and validation cohorts. (C,D) Calibration plot of 3 and 5-year CVD risk prediction in the training and validation cohorts. (E,F) Time-dependent ROC curves in the training and validation cohorts. Abbreviations: CVD, cardiovascular disease; ROC, receiver operator characteristic; AUC, area under the curve. Youden index = sensitivity + specificity – 1.

