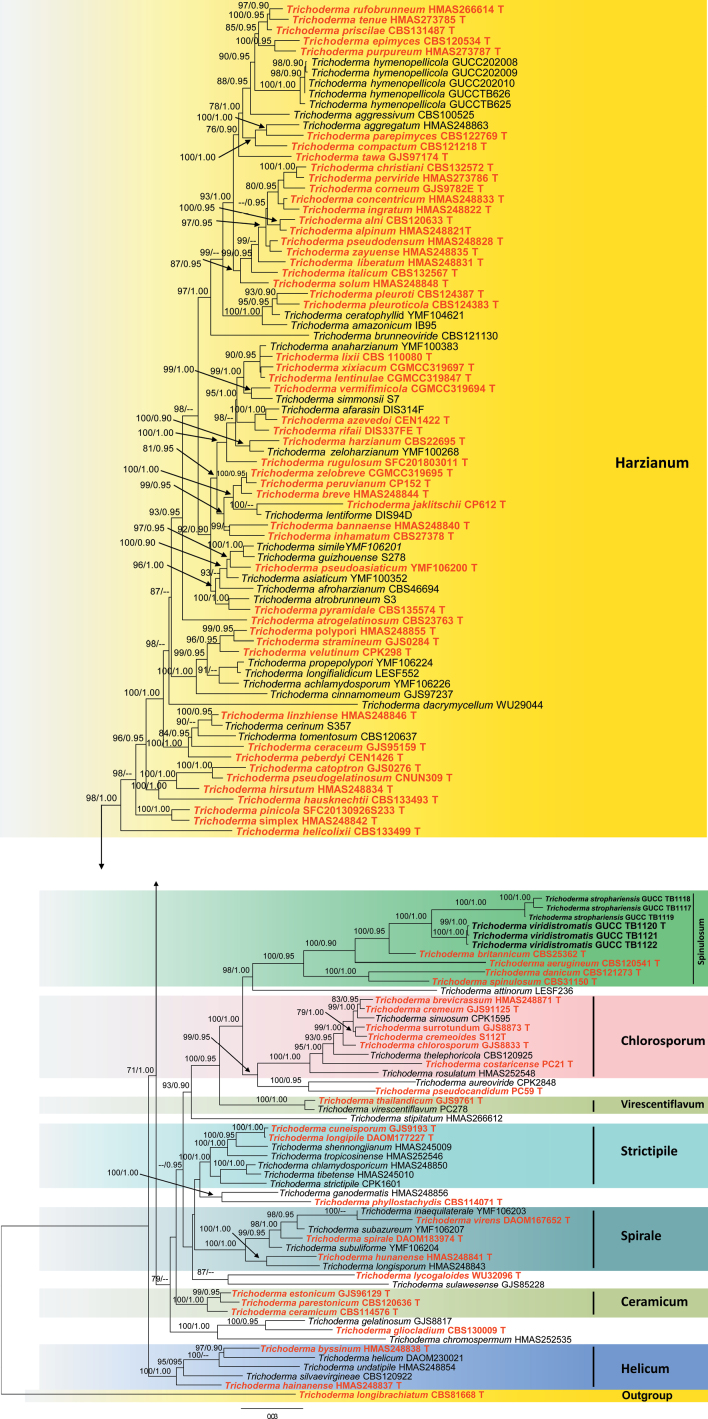
Figure 2.
A phylogram was constructed using ML analysis, utilizing a combined ITS, rpb2, and tef1-α sequences dataset. The green-spored T.longibrachiatum (CBS81668) was used as the outgroup taxon following Zeng et al. (2022). The tree with the highest score according to RAxML, with a final probability value of -InL = 37957.575772, is displayed. Maximum Likelihood (ML) values equal to or greater than 70% and Bayesian Inference (BI) values equal to or greater than 0.90 are given above the nodes (ML values on the left side of ‘/’ in regular font and BI values on right side of ‘/’ in italics). Type strain sequences are indicated in red bold, while newly generated sequences are shown in black bold. Strain numbers for the sequences are shown in the tree following the taxon name. ‘T’ denotes ex-holotype strains.

