Fig. 11.
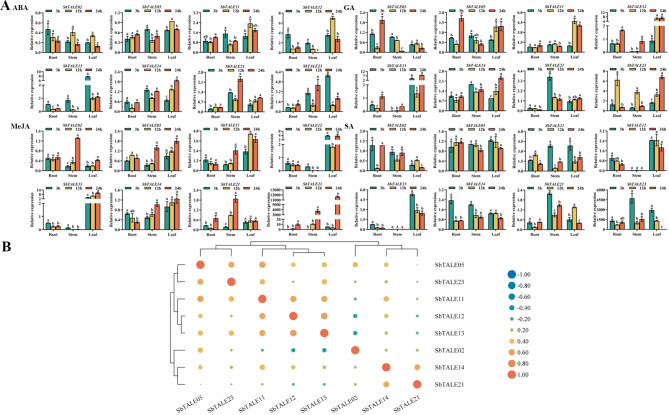
The spatiotemporal expression levels and correlation analysis of eight SbTALEs (SbTALE02, SbTALE05, SbTALE11, SbTALE12, SbTALE13, SbTALE14, SbTALE21, and SbTALE23) under four hormonal treatments (ABA, GA, MeJA, and SA) at the seedling stage. (A) Expression levels of eight SbTALEs at 3 h, 12 h, and 24 h in root, stem and leaf. Values of the column chart are expressed as mean ± SD, the lowercase letters represent significant differences (p < 0.05, Duncan). (B) Correlation hierarchical cluster analysis between their expression in different tissues. Positive number represents positive correlation and negative number indicates negative correlation

