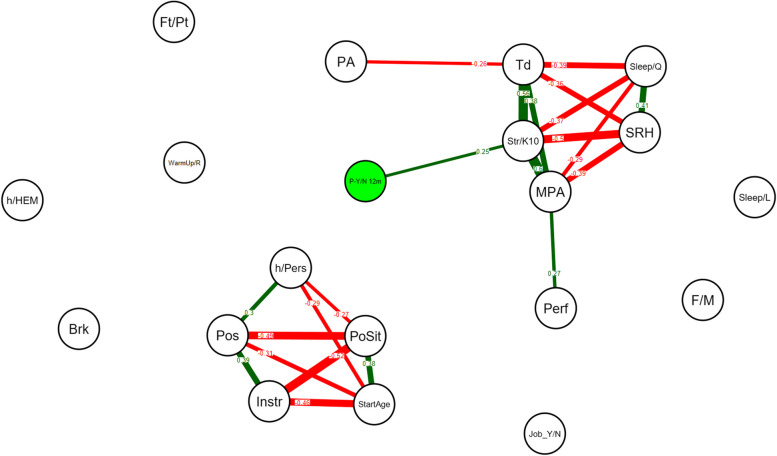
Fig. 1.
Network analysis on all variables across all participants (N = 235), on absence (no) or presence (yes) of the PRMDs variable over the last 12 months. A line between the nodes representing the variables indicates a significant correlation. Absence of a line (edge) between two variables indicates a non-significant correlation. Green edges indicate positive correlations and red edges indicate negative correlations. The number on the line (correlation coefficient) and its thickness represent the strength of the correlation. Only significant correlations (p < 0.05) are shown, using Bonferroni corrections. P-Y/N 12m: Pain yes – no in the last 12 months (MPIIQM), Str/K10: Kessler Psychological Distress Scale, MPA: Kenny Music Performance Anxiety Inventory, Td: Tiredness, SRH: Self-rated Health, PA: Physical Activity, Sleep/Q: sleep quality, Perf: perfectionism, Pls: Pleasantness, Sleep/L: Sleep duration, F/M: gender, h/Pers: weekly hours played personally, PoSit: posture sitting or standing, Pos: posture according with upper limb position, StartAge: Starting Age Playing Instrument, Instr: instrument, Brk: break’ organization, Neuro: neurological previous disease, h/HEM: Weekly hours played at HEM-GE,, Ft/Pt: Full or Part-time job, Job_Y/N: student job,, WarmUp/R: warm-up and recovery exercises

