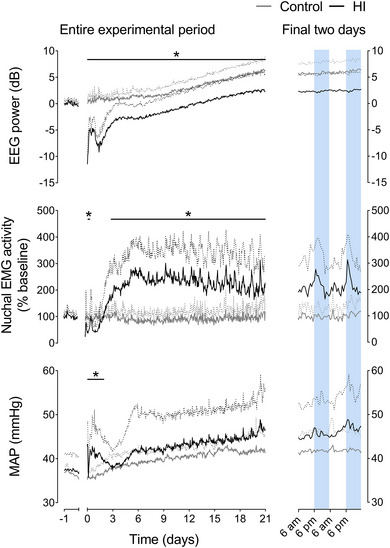
Figure 1. EEG power, nuchal EMG activity and MAP after HI.

Left: time sequence of changes in EEG power, nuchal EMG activity and MAP from 1 day before until 21 days after sham occlusion (control, grey, n = 7) or HI (black, n = 7 for EEG power and nuchal EMG; from day 2−21 n = 6 for MAP) induced by umbilical cord occlusion. The period of occlusion is not shown, data are shown as the 1‐h mean ± SD (SD shown as dotted lines). Statistical analysis comprised ANOVA with group as the independent factor and time as repeated measure. *P < 0.05, effect of HI. For exact p values, see text and Statistical Summary Document. Right: enlargement of the final 48 h of recovery for each parameter. Shading represents the hours of darkness (18.00 h to 06.00 h). [Colour figure can be viewed at wileyonlinelibrary.com]
