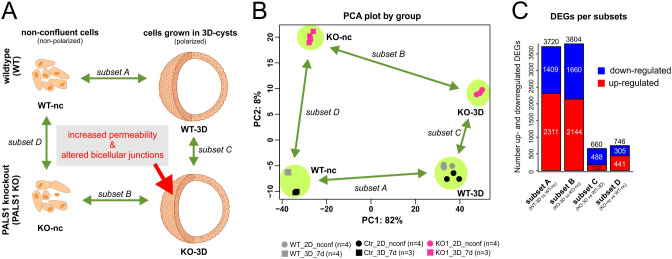
Fig. 1.
Analyses of the mRNA profiles of wildtype and PALS1 KO MDCK cells grown under non-confluent conditions and in 3-dimensional cysts. A: Schematic overview of the experimental setup and the four performed comparisons. The transcriptomes of non-confluent MDCK wildtype cells were compared to cells grown in 3D cyst cultures (WT-3D vs. WT-nc). The differentially expressed genes (DEGs) of this comparison were called subset A. The analogous approach done with PALS1 knockout (KO) MDCK cells (KO-3D vs. KO-nc) represents the subset B of DEGs. The comparison of transcriptomes of WT and KO 3D cysts (KO-3D vs. WT-3D) resulted in DEGs that are represented by subset C. The analogous comparison of non-confluent WT and KO cells is subset D (KO-nc vs. WT-nc). B: PC1 and PC2 of principal component analysis normalized transcriptome expression values from all replicates of experimental groups. Samples of the starting wildtype cell pool, and a control cell line in which the PALS1 gene remained unaffected after the CRISPR/Cas9 mutagenesis process were combined leading to four different groups (WT-nc, KO-nc, WT-3D, and KO-3D, Fig. SF1). Only minor differences were apparent between CRISPR/Cas9 controls and untreated WT cells, both at non-confluent and at 3D cyst stages. Each dot represents an independent biological replicate. A clear separation was apparent between WT and KO and non-confluent and 3D cyst groups. Replicates grouped well together. C: Number of total-, up- and downregulated DEGs of subset A and subset B, and subset C and subset D. Subsets A and B showed a much higher number of DEGs in comparison to subset C and D

