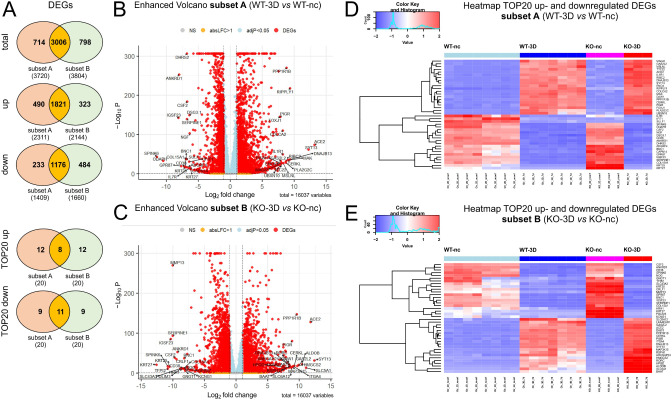
Fig. 2.
Summary of DEGs of WT and PALS1 KO MDCK during cell polarization. A: Venn diagrams illustrating overlaps of total (upper diagram), upregulated (middle diagram) and downregulated DEGs of subsets A and subset B. The two down Venn diagrams show shared genes of the top 20 up- or downregulated DEGs of the subsets A and B. In all cases most of the DEGs were shared by subsets A and B. B and C: Volcano plots of DEGs of subsets A (B) and subset B (C), with annotated TOP20 up- and downregulated genes. y-axis: -log10 adj. P, x-axis: log2 fold change. DEGs are colored red and the TOP20 up- and down-regulated (by log-fold change) DEGs are labeled. Blue: genes with adj. P < 0.05. Yellow: genes with absolute log2-fold change > 1. D and E: Heatmap of TOP20 upregulated (D) and downregulated DEGs (E) showing the difference of relative gene expression levels in WT and PALS1 KO MDCK cells

