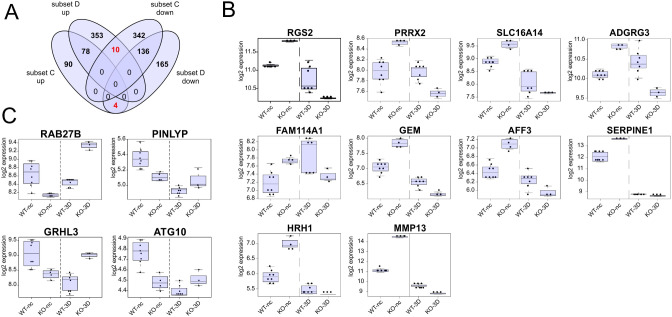
Fig. 8.
DEGs with an inversed expression profile in non-confluent monolayers and 3D cysts. A: 4-way Venn diagram illustrating overlaps of up- and downregulated DEGs of subsets C and D. The analyses revealed 14 DEGs with a “reciprocal” expression pattern meaning that they were among the upregulated DEGs of subset C (WT vs. KO at 3D stage) and downregulated in subset D (WT vs. KO at non-confluent stage), or vice versa. B: Box plot of the ten DEGs that were expressed higher in KO than in WT cells during non-confluent conditions but less expressed in the KO than in WT cells at the 3D stage. C: Box plot of the four DEGs that were expressed higher in WT than in KO cells during non-confluent conditions but less expressed in the WT than in KO cells at the 3D stage. WT-nc; KO-nc: expression level of WT or KO cells grown under non-confluent conditions; WT-3D; KO-3D samples: expression levels of WT or KO cells grown as 3D cysts. Each dot represents the expression value of a single sample of independent biological replicates

