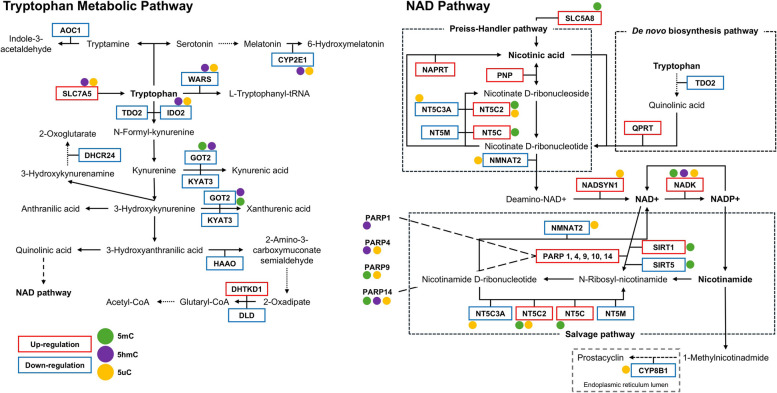
Fig. 3.
Overview of the differentially expressed genes and DNA (hydroxy)methylation levels within the TRP metabolic pathway and NAD pathway. Within the TRP metabolic pathway, a total of 12 genes exhibited significant differential gene expression, while 20 genes were differentially expressed within the NAD pathway. Genes exhibiting up-regulation in expression are highlighted with red box, whereas those with down-regulation are indicated by blue box. Genes with altered DNA (hydroxy)methylation levels are denoted by circular markers, with distinct colors representing specific modifications: 5mC (green), 5hmC (purple), and 5uC (orange)

