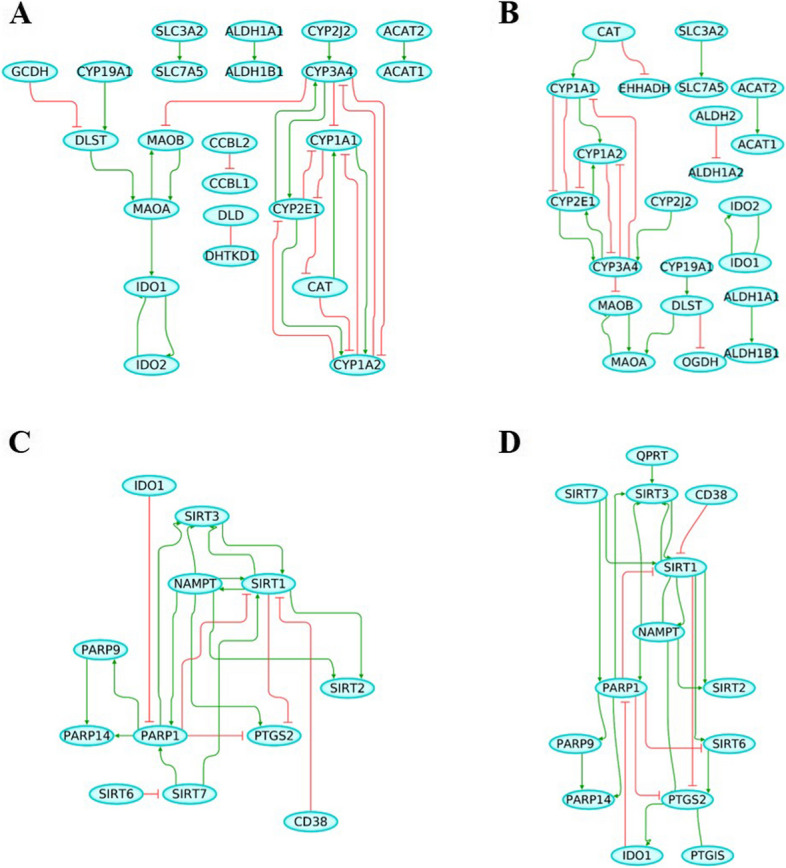
Fig. 6.

Gene regulatory network (GRN) of TRP and NAD pathway. A TRP GRN representing the control phenotype and containing 22 nodes and 30 interactions, (B) TRP GRN representing Alzheimer’s disease (AD) phenotype and containing 22 nodes and 25 interactions, (C) NAD GRN representing the control phenotype and containing 13 nodes and 21 interactions, (D) NAD GRN representing Alzheimer’s disease (AD) phenotype and containing 14 nodes and 24 interactions. Green line indicates gene activation while red line indicates gene inhibition
