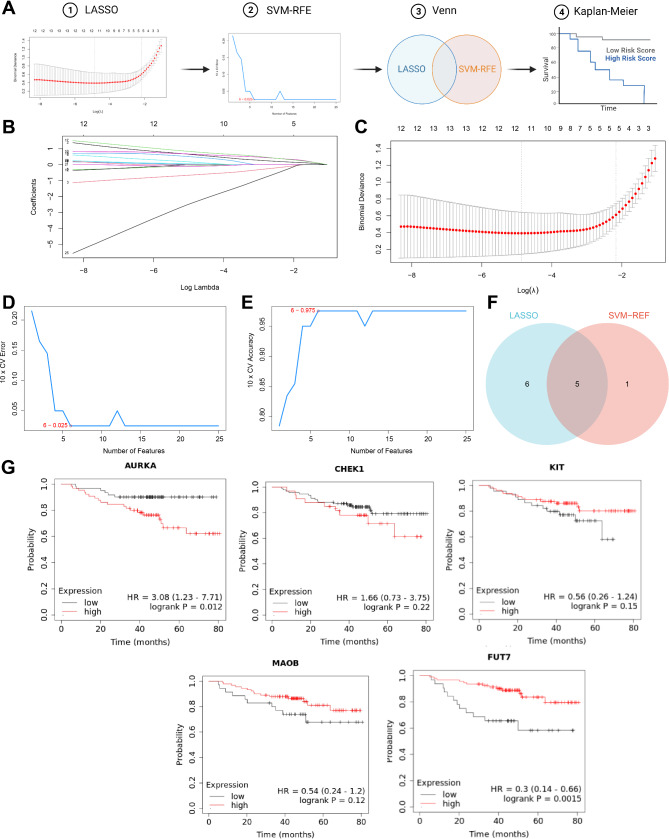
Fig. 3.
Further selection of core targets using machine learning and survival curve analysis. Note: (A) The schematic of the bioinformatics analysis process; (B) Coefficients of different genes vary with different λ values; (C) The optimal parameter (lambda) identified through cross-validation of LASSO regression analysis; (D-E) Important features recognition of the 25 genes based on the SVM-RFE algorithm; F: 5 candidate targets obtained from the results of LASSO and SVM-RFE algorithms; G: Survival curve plots for the five candidate targets in TNBC

