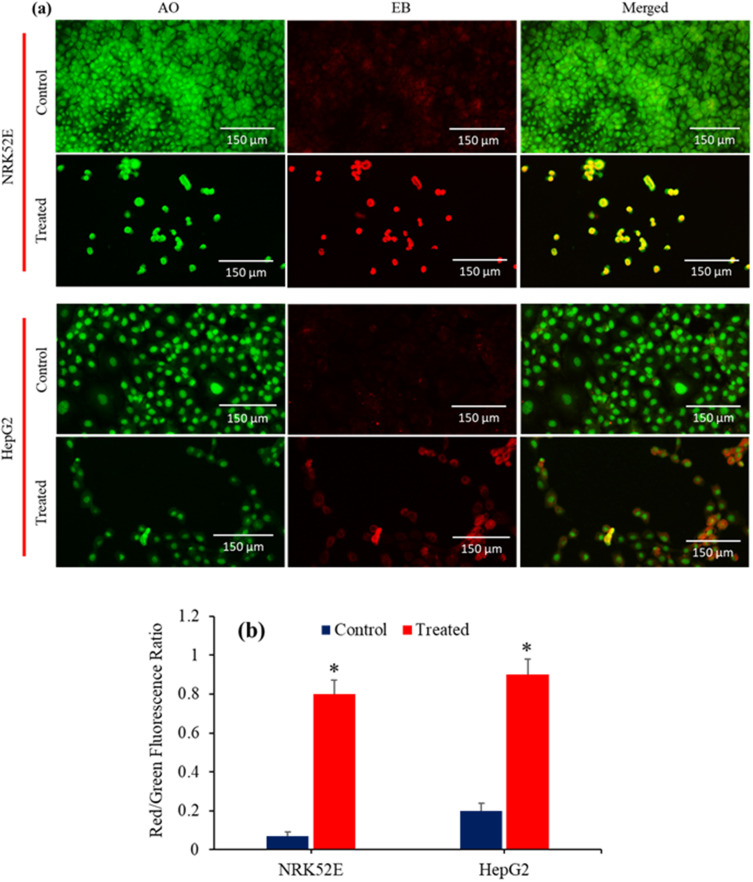
Figure 12.
(a) AO-EB dual staining to study the apoptosis response in NRK52E and HepG2 cells following exposure to Bi2O3/RGO nanocomposites for 48 h. Apoptosis cells emit an Orange-red fluorescence stain, whereas healthy cells emit green fluorescence. (b) Graphical representation of red/green fluorescence ratio. Quantitative data is represented as the mean±SD of three separate experiments (n=3). *Significantly different as compared to the control (p<0.05).

