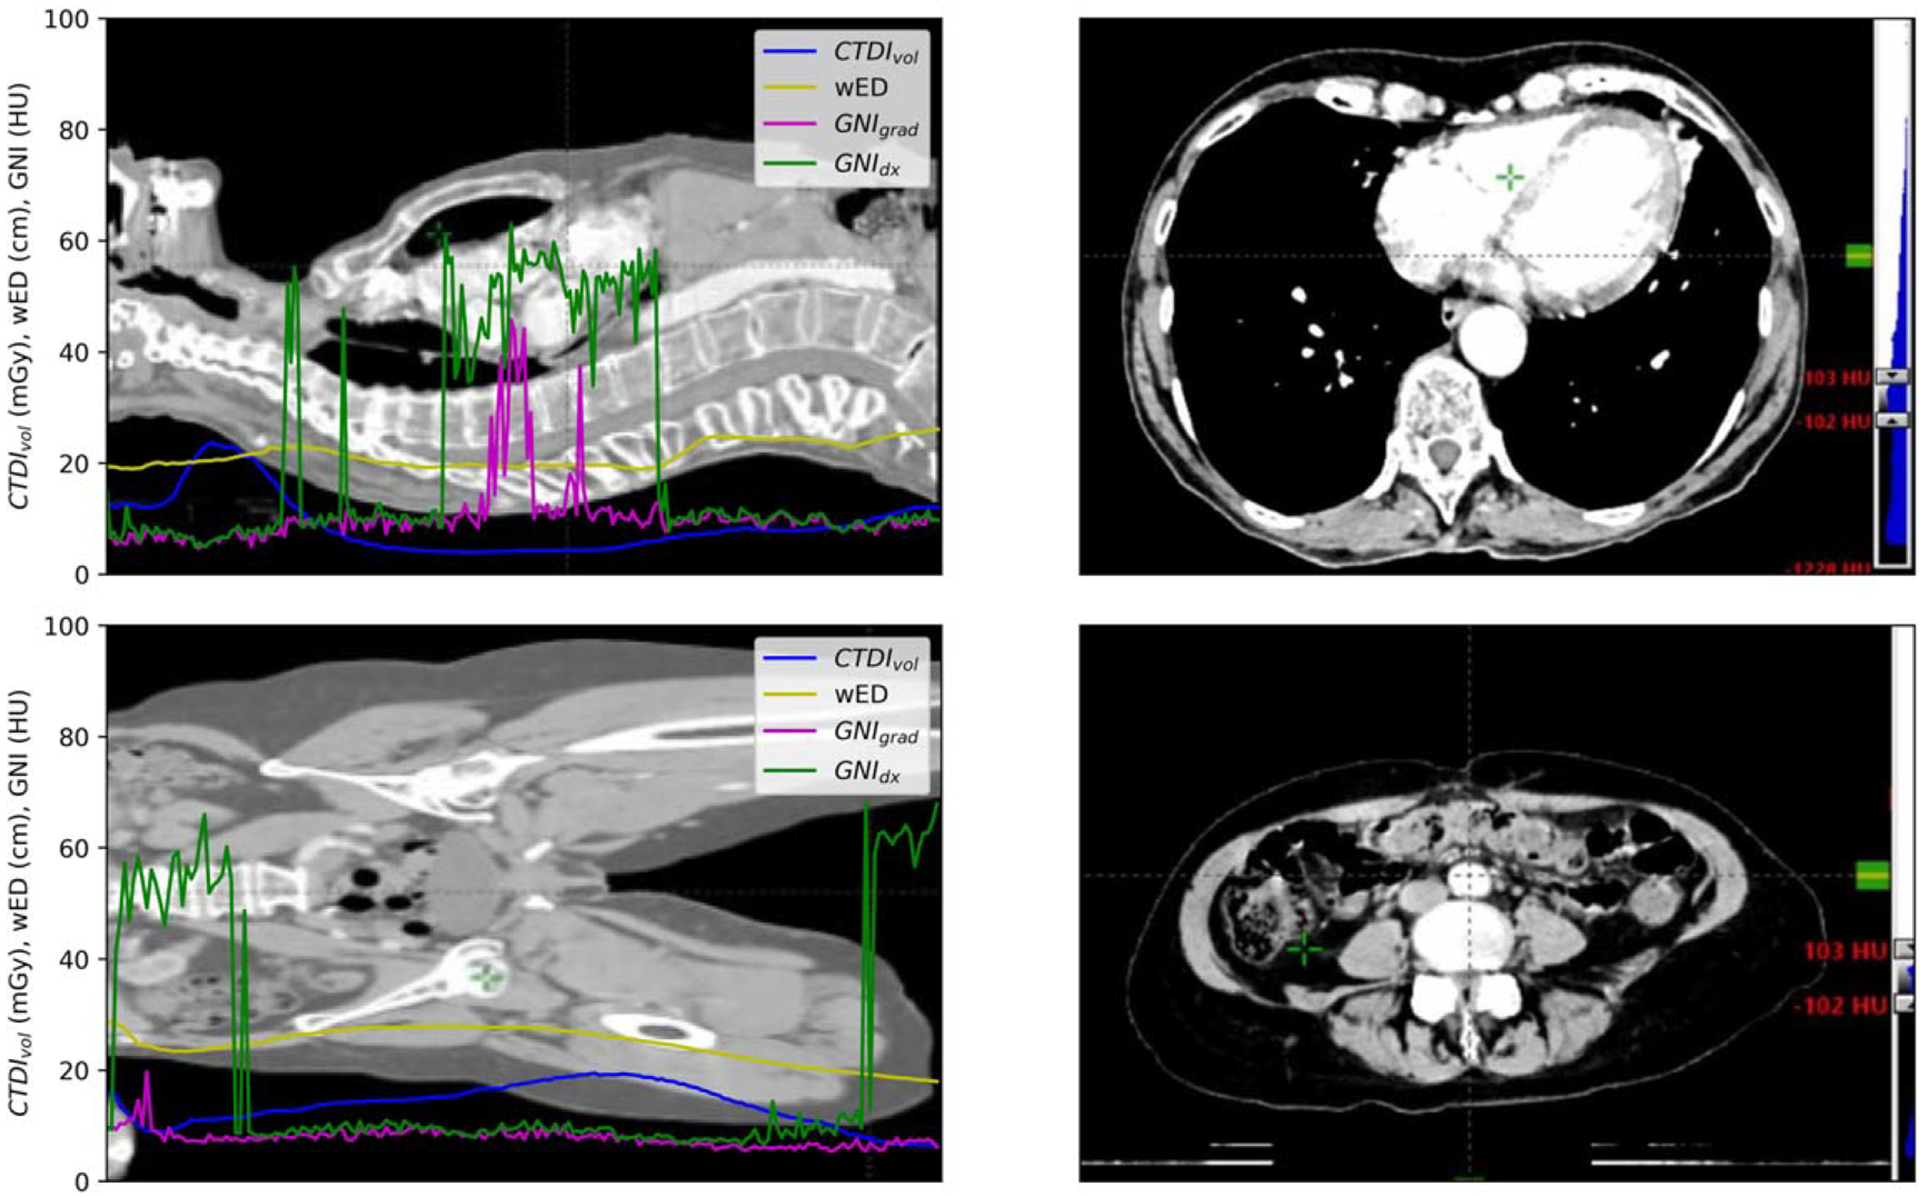
Figure 2.

The CTDIvol, wED, GNIgrad, and GNIdx distribution along the scanned length of lung (up left) and groin patient (low left). Right site shows the CT image window at [−100, 100] to demonstrate the scenarios of the images with large GNIdx values.
