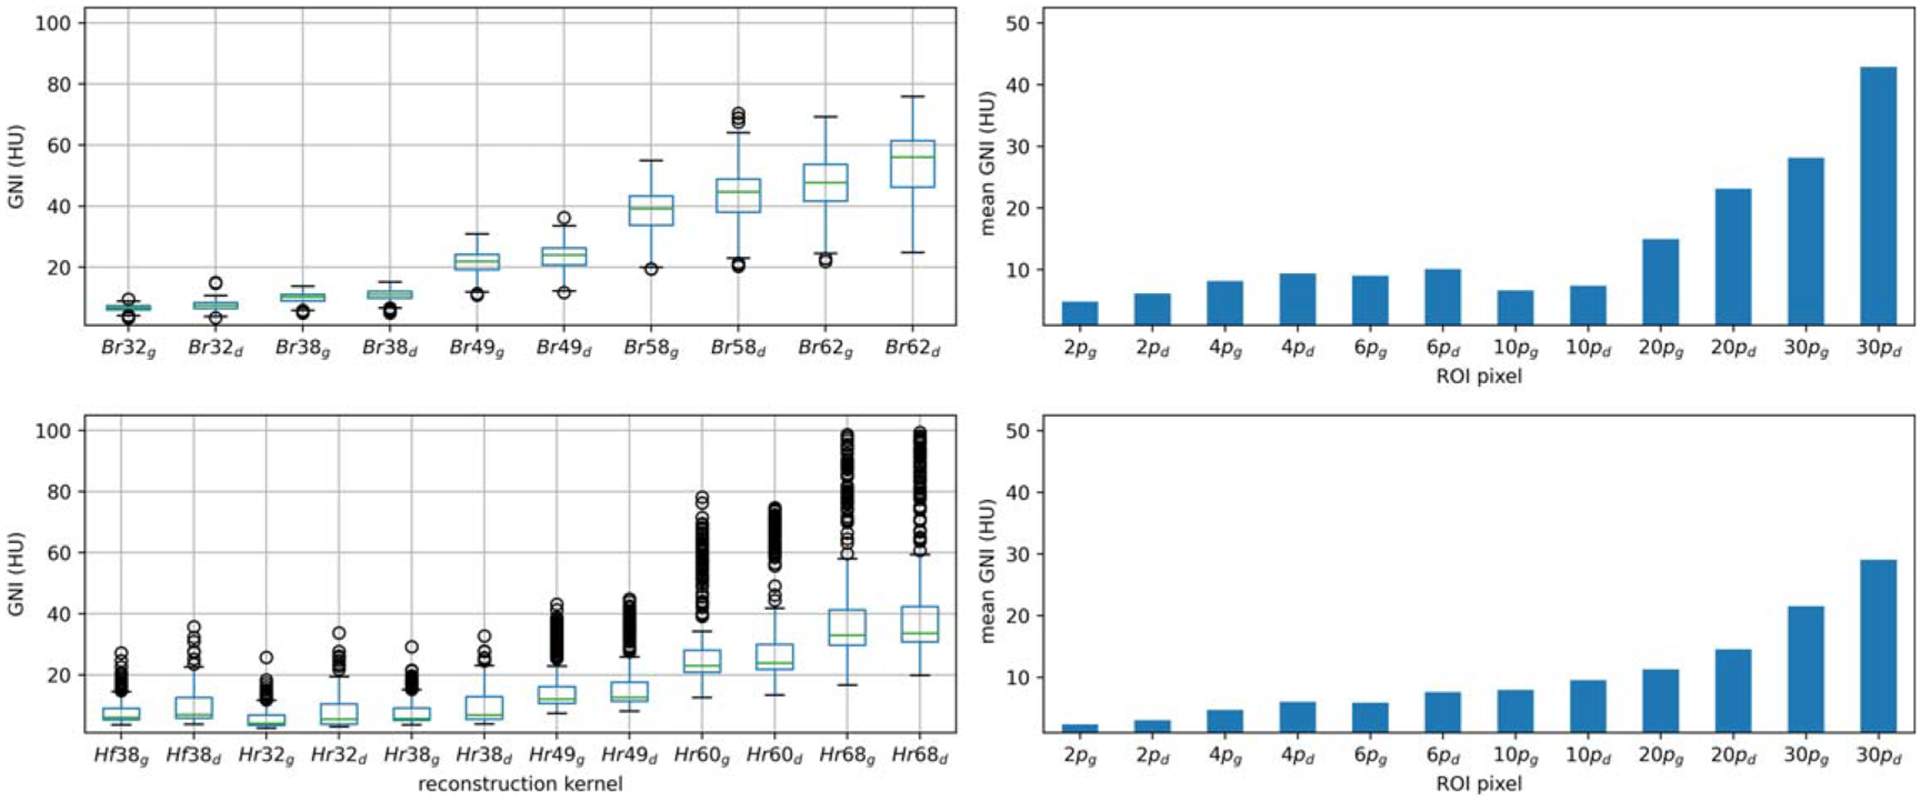
Figure 7.

Boxplots (left; up-paraspinal case, bottom-brain case) showed the variation of the global noise index Versus the reconstruction kernel from smooth kernel to sharp kernel. Bar charts (right; up-paraspinal case, bottom-brain case) showed the sensitivity of the mean global noise index on the choice of ROI size. Subscript ‘g’ denotes the parameter calculated for GNIgrad; subscript ‘d’ denotes the parameter calculated for GNIdx.
