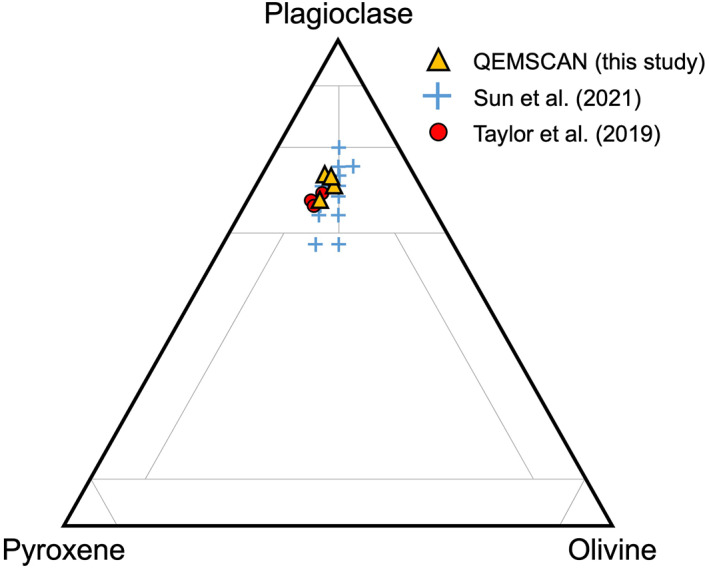
Figure 15.

Ternary diagram plotting mineral modal abundances (after Sun et al. (2021)). This diagram is intended to represent mineral proportions and not lunar rock types although those regions are depicted for reference (Stöffler et al., 1980). Radiative transfer modeling using a hyperspectral profile through the core is represented by blue crosses (Sun et al., 2021). Apollo 17 Station 3 soils measured using XRD are represented by red symbols (Taylor et al., 2019).
