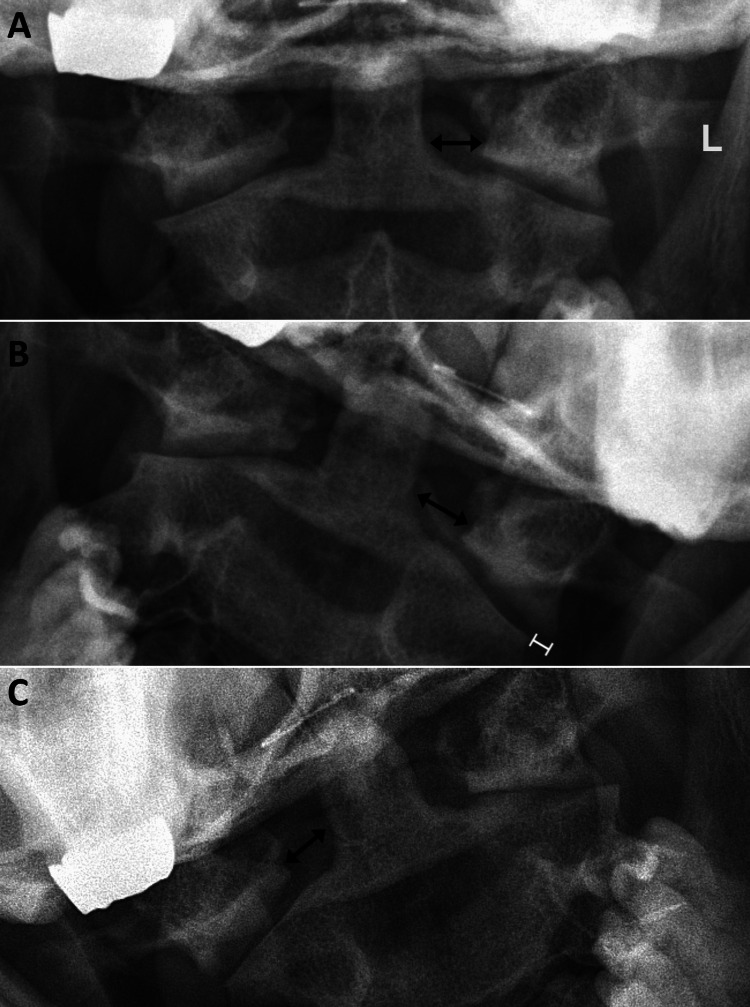
Figure 3. Anteroposterior open mouth lateral bending radiographs.
The left (L) side marker is shown in the top image, which is consistent across each image (A, B, and C). The neutral image (A) depicts asymmetry of the odontoid-lateral mass interval (OLMI) (double-sided arrows) of 1.7 millimeters (mm) with OLMI measurement larger on the left (7.5 mm) than on the right (5.8 mm). The left lateral bending image (B) demonstrates an increase in OLMI asymmetry to 4.2 mm with OLMI larger on the left (8.0 mm) than on the right (3.8 mm). The right lateral bending image (C) demonstrates an asymmetrical OLMI, albeit smaller in magnitude (7.3 mm on the right, 5.8 mm on the left; asymmetry of 1.5 mm). A step-off is visible with left lateral bending (B), as the left lateral mass is displaced 2.4 mm to the left relative to the articular pillar of C2.

