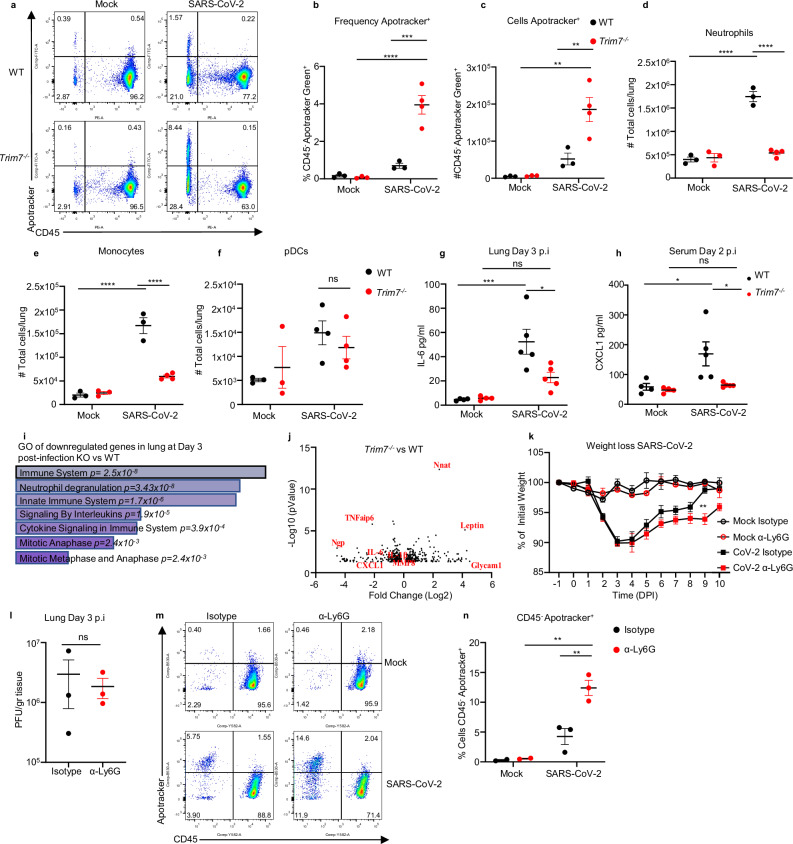
Fig. 3. Trim7−/− mice have impaired innate immune response to SARS-CoV-2 infection.
a–j Male C57BL/6NJ WT and Trim7−/− mice were infected with maSARS-CoV-2 (WT n = 3, KO n = 4). On day 3 post infection, lung cells were stained for CD45 and Apotracker Green (a representative FACS dot plots; b frequency of CD45-/Apotracker Green+ cells; c total number of CD45-/Apotracker cells per lung). d Total number of neutrophils (CD45+CD11c-CD11b+Ly6CintLy6Ghi). e Total monocytes (CD45+CD11c-CD11b+Ly6ChiLy6G-). f Total pDCs (CD45+CD11cloPDCA-1+CD11b−). Two-way ANOVA Tukey’s multiple comparisons (***p = 0.0002, ****p < 0.0001). g 23-Bioplex analysis shows IL-6 levels in lung homogenate, or h CXCL1 in serum (complete Bioplex shown in S4a, b). Two-way ANOVA Tukey’s multiple comparisons (***p = 0.0006, *p = 0.01, p = 0.02). i, j RNAseq analysis of infected lungs at day 3 post infection. i Gene ontology of genes downregulated in Trim7−/− mice. j Volcano plot of the RNAseq (n = 3 per group, Wald test). k–n Neutrophil depletion in WT mice using anti-Ly6G antibody or isotype as control followed by infected with maSARS-CoV-2 (n = 8) (**p = 0.001), weigh loss (k), viral titers (l, n = 3), two-tailed T-test analysis, representative dot blot of lung cells (m, CD45/Apotracker Green), frequency CD45−/Apotracker Green+ cells (n), two-way ANOVA Tukey’s multiple comparisons (**p = 0.001, p = 0.006). Data were depicted as Mean ± SEM. DPI days post infection, GO gene ontology, α-Ly6G anti-Ly6G. Source data are provided in the Source data file.

