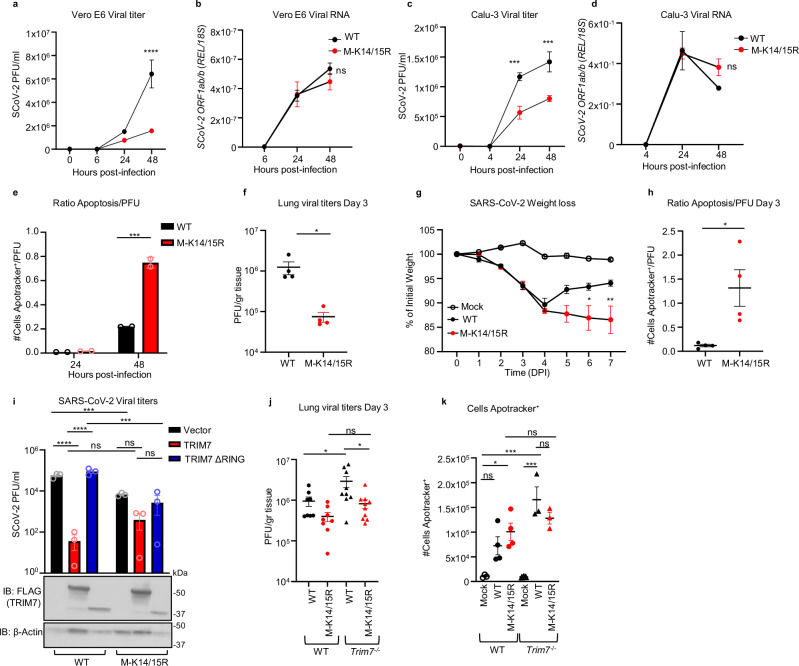
Fig. 5. Recombinant virus with M K14/K15 mutations shows increased pathogenesis.
Vero E6 (a, b) or Calu-3 (c, d) infected with SARS-Cov-2 WT or M-K14/15R MOI 0.1 and 1, respectively. Viral titers (a, c) and viral RNA by qPCR (b, d). Two-way ANOVA Tukey’s multiple comparisons (****p < 0.0001, ***p = 0.001, p = 0.0007). e Ratio of cells in apoptosis Apotracker+ normalized by viral titers (Apotracker+/PFU) in Calu-3 cells. Data were representative of two independent experiments, each with two biological replicates. Multiple T-test comparison (***p = 0.003). f–h WT C57BL/6J male mice infected with SARS-CoV-2 WT (n = 8) or M-K14/15R mutant viruses (n = 10) and mock (n = 5). f viral titers in lung (n = 4), two-tailed t-test analysis (*p = 0.036). g weight loss curve. Two-way ANOVA Tukey’s multiple comparisons (*p = 0.02, **p = 0.001). h Ratio of cells in apoptosis in the lung (Apotracker+/PFU, n = 4). Two-tailed t-test analysis (*p = 0.02). i Viral titers of HEK293T-hACE-2 cells transfected with 200 ng of TRIM7 WT or TRIM7 ΔRING and infected with SARS-CoV-2 WT or M K14/15R at MOI 0.1 (bottom panel shows immunoblot for TRIM7). Two-way ANOVA Tukey’s multiple comparisons (****p < 0.0001, ***p = 0.0007). WT (n = 8, 6 males, 2 females) and Trim7−/− (n = 9 and 11, 7 or 9 males and 2 females) infected with SARS-CoV-2 WT or M-K14/15R and euthanized at day 3. j Lung viral titers are combined data from two independent experiments (*p = 0.038, 0.016). k Total number of cells in apoptosis (CD45 +Apotracker+) are representative of 1 of the 2 independent experiments shown in (j). Mock n = 3/group, SARS-CoV-2 WT n = 4 in WT and 3 in Trim7−/− mice. M K14/15R virus n = 4 in WT and 3 in Trim7−/−. One-way ANOVA Tukey’s multiple comparisons (*p = 0.014, ***p = 0.0002). Data were depicted as mean ± SEM. DPI days post infection. Source data are provided in the Source data file.

