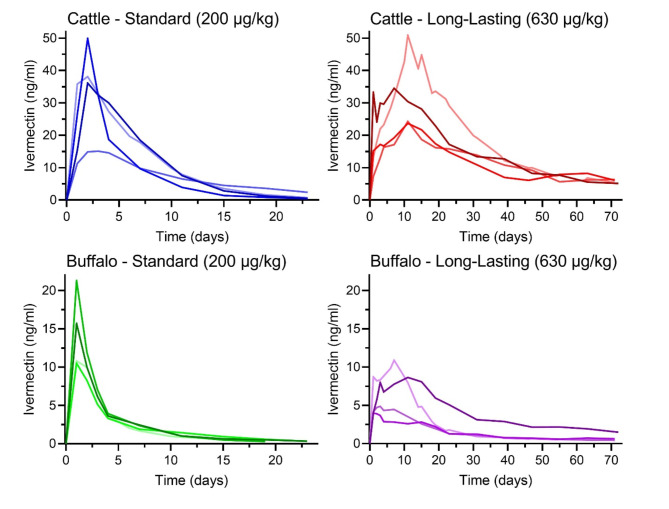
Fig. 2.
Depicts the ivermectin concentrations found in cattle (top panels) and buffalo (bottom panels) following injection of standard (left panels) and long-lasting (right panels) ivermectin formulations. Each line represents the ivermectin concentrations from an individual animal. The ivermectin pharmacokinetic concentrations of livestock from Pandawawi which were injected with slightly higher doses (1 ml more than manufacturer recommended dose) are represented as the darkest lines for each species and treatment group.

