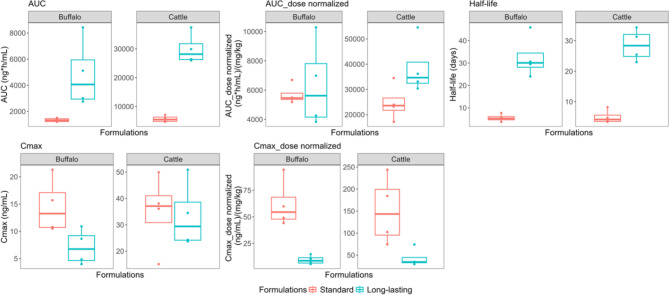
Fig. 3.
Depicts pharmacokinetic parameters of buffalo and cattle injected with standard (red box plots) and long-lasting (blue box plots) ivermectin. From left to right, the figure comprises area under the concentration-time curve (AUC), AUC_dose normalized, maximum concentration (Cmax), Cmax_dose normalized, half-life. AUC_dose normalized is dose normalized AUC (ng*h/mL)/(mg/kg). Cmax_dose normalized is dose normalized Cmax (ng/mL)/(mg/kg). Each panel presents box and whisker plots comparing each pharmacokinetic parameter between standard (orange) and long-lasting formulations (turquoise) within species, buffalo and cattle. Dots represent observed data.

