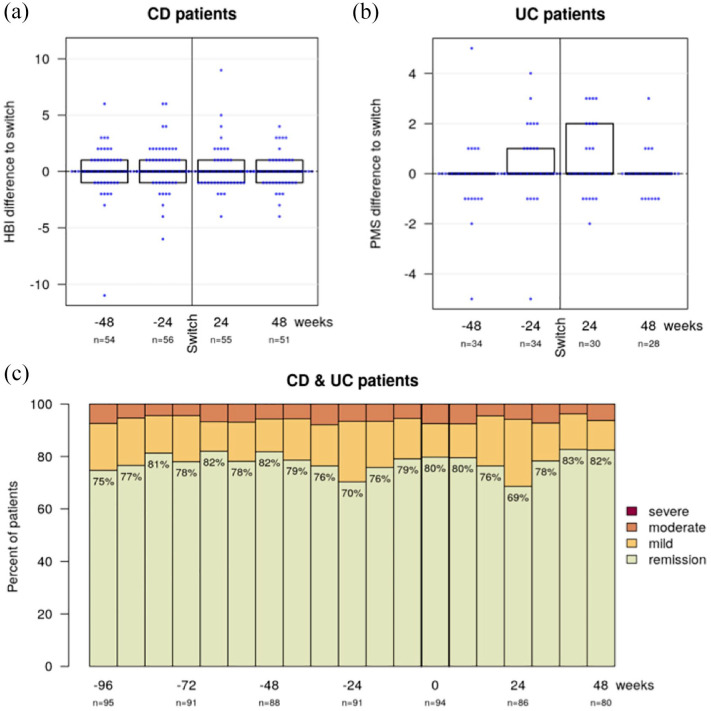
Figure 1.
These combined bee swarm and boxplots illustrate the change of disease activity scores compared to baseline for 48 weeks before and after the second switch in Crohn’s disease (a) and ulcerative colitis (b) patients. The proportion of patients in remission, with mild or moderate disease activity (c), remained stable during the observation period. There were no cases of severe disease activity.

